
 Google Cloud Observability
 Chronosphere
 Observe
 Sematext
 Splunk Observability Cloud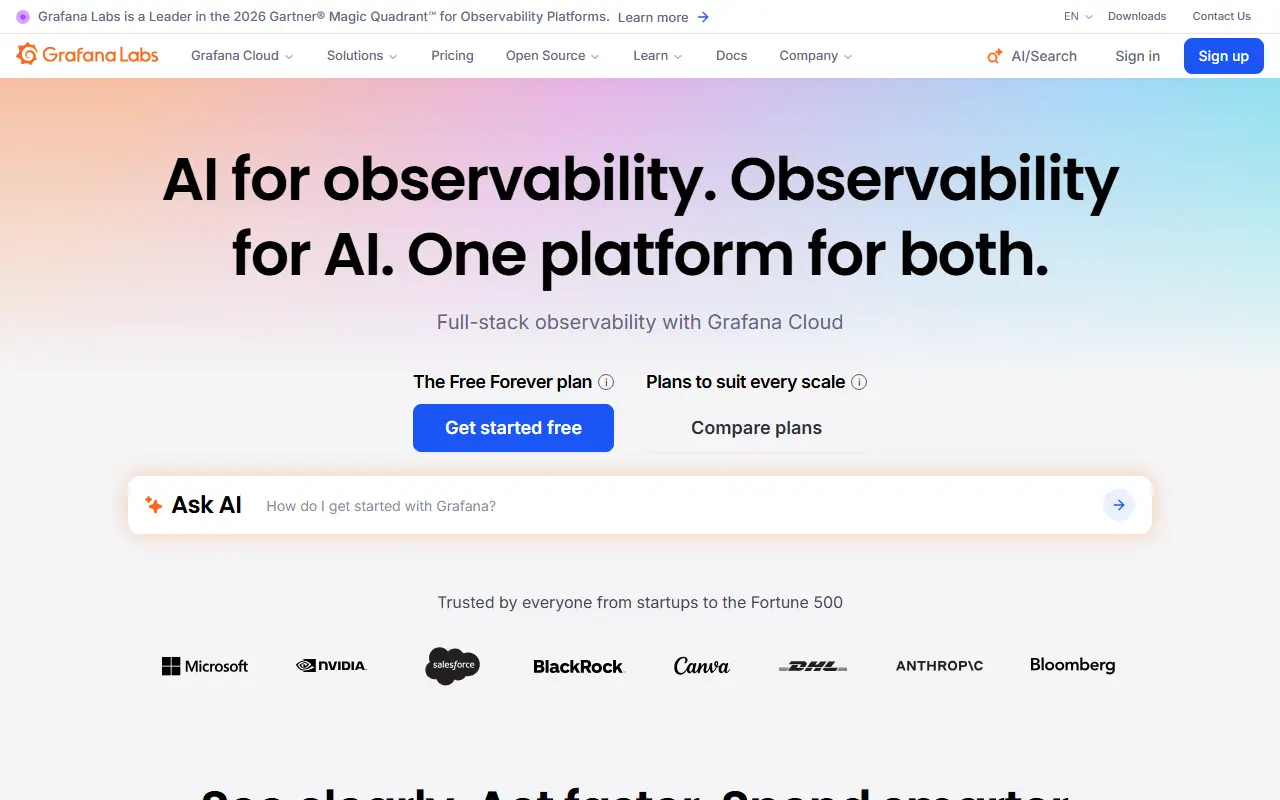
About Grafana
Grafana is a visualization and observability platform that lets you query, chart and alert on data wherever it is stored. It does not hold your data itself; it connects to sources such as Prometheus, Loki, Elasticsearch, InfluxDB, MySQL and PostgreSQL and brings their results together in shared dashboards.
Dashboards can be made reusable with template variables that appear as dropdowns, and a single graph may mix queries against different data sources. Explore views support ad-hoc queries, side-by-side comparison of time ranges and a jump from metrics to logs while keeping label filters. Alert rules are defined visually, and notifications go to systems like Slack, PagerDuty, VictorOps and OpsGenie. Panel plugins add further visualization types.
Grafana is AGPL-3.0 licensed, written in Go and TypeScript, and can be installed on your own servers; Grafana Labs also runs a hosted offering. It is common in DevOps and SRE teams as the dashboard layer on top of Prometheus-style monitoring, and a public demo site lets you try it first.
Key features
- Dashboards with template variables
- Mixed data sources in a single graph
- Visual alert rules with Slack and PagerDuty
- Explore view for ad-hoc metric and log queries
- Panel plugins for extra visualizations
- Connects to Prometheus, Loki and SQL databases
Good fit for
- →Dashboards for Prometheus metrics
- →Unified view of metrics, logs and traces
- →On-call alerting for infrastructure teams
- Tags
- dashboards
- observability
- monitoring
- visualization
- metrics
- logs
- alerting
- prometheus
- analytics
Grafana: questions and answers
- What is Grafana used for?
- Grafana is an open-source platform for visualizing metrics, logs and traces from many data sources, with dashboards, alerting and ad-hoc exploration. It is a good fit for dashboards for Prometheus metrics; unified view of metrics, logs and traces; and on-call alerting for infrastructure teams.
- Is Grafana open source?
- Yes. Grafana is open source under the AGPL-3.0 licence. Its source code is on GitHub at grafana/grafana and is written mainly in TypeScript.
- Is Grafana free?
- Yes. Grafana is open source, so the software itself is free to use. A managed cloud version is also available.
- Can I self-host Grafana?
- Yes. Grafana can be self-hosted on your own server or infrastructure.
- What is Grafana an alternative to?
- Grafana is an open-source alternative to Datadog, Dynatrace, Splunk and New Relic. Other open-source alternatives to Datadog include SigNoz, OpenObserve and Prometheus.
- Is Grafana actively maintained?
- Yes. The most recent commit to Grafana was on 2 October 2026, and the latest release is v13.2.3, published on 29 September 2026. The project has 77k stars on GitHub.
Open-source alternatives to Grafana
See all
SigNoz
Monitoring & Observability
SigNoz Cloud is a one-stop observability tool built on top of OpenTelemetry. Get APM, logs
OSSvs Datadog★ 32k
OpenObserve
Monitoring & Observability
High-performance, unified observability for the AI era. 140x lower storage cost.
AGPL-3.0vs Datadog★ 22k
Prometheus
Monitoring & Observability
The Prometheus monitoring system and time series database.
Apache-2.0vs Datadog★ 66k
Grafana Loki
Monitoring & Observability
Like Prometheus, but for logs.
AGPL-3.0vs Datadog★ 29k
Netdata
Monitoring & Observability
The fastest path to AI-powered full stack observability, even for lean teams.
GPL-3.0vs Datadog★ 81k
VictoriaMetrics
Monitoring & Observability
VictoriaMetrics: fast, cost-effective monitoring solution and time series database
Apache-2.0vs Datadog★ 18k
SaaS alternatives to Grafana
See all
Datadog
Monitoring & Observability
Datadog is a cloud monitoring and observability platform that brings metrics, logs and traces from applications, tools and services into one place.
SaaS
Dynatrace
Monitoring & Observability
Full-stack observability with automatic instrumentation and AI-based root-cause analysis
SaaS
Splunk
Monitoring & Observability
Splunk is a data platform for security and observability that collects, searches and analyzes machine data to detect threats and prevent downtime.
SaaS
New Relic
Monitoring & Observability
Observability platform for application performance, infrastructure and logs
SaaS
Amazon CloudWatch
Monitoring & Observability
AWS service for metrics, logs, alarms and dashboards
SaaS
Azure Monitor
Monitoring & Observability
Azure service for collecting and analyzing metrics, logs and traces
SaaS