7,363 open-source and SaaS tools, with GitHub stats refreshed every day.

9 alternatives ranked by real activity

Open-source Sisense alternatives

A curated, ranked list of the 9 best open-source alternatives to Sisense.

The best open-source alternative to Sisense is Superset. If that doesn't suit you, other good options are Metabase, Cube, Lightdash and Chartbrew.

Sisense alternatives are mainly BI & dashboard tools. 8 of them shipped code in the last 30 days, 9 can be self-hosted, and 5 use a permissive licence.

Last updated October 2, 2026 · ranked by GitHub stars, growth and recent commits

Superset

A web-based business intelligence platform from the Apache project with a no-code chart builder, SQL editor and dashboards that connects to most SQL databases.

GitHub stars
75k
Last commit
today
Latest release
6.1.0
Licence
Apache-2.0
Self-hosted
Yes
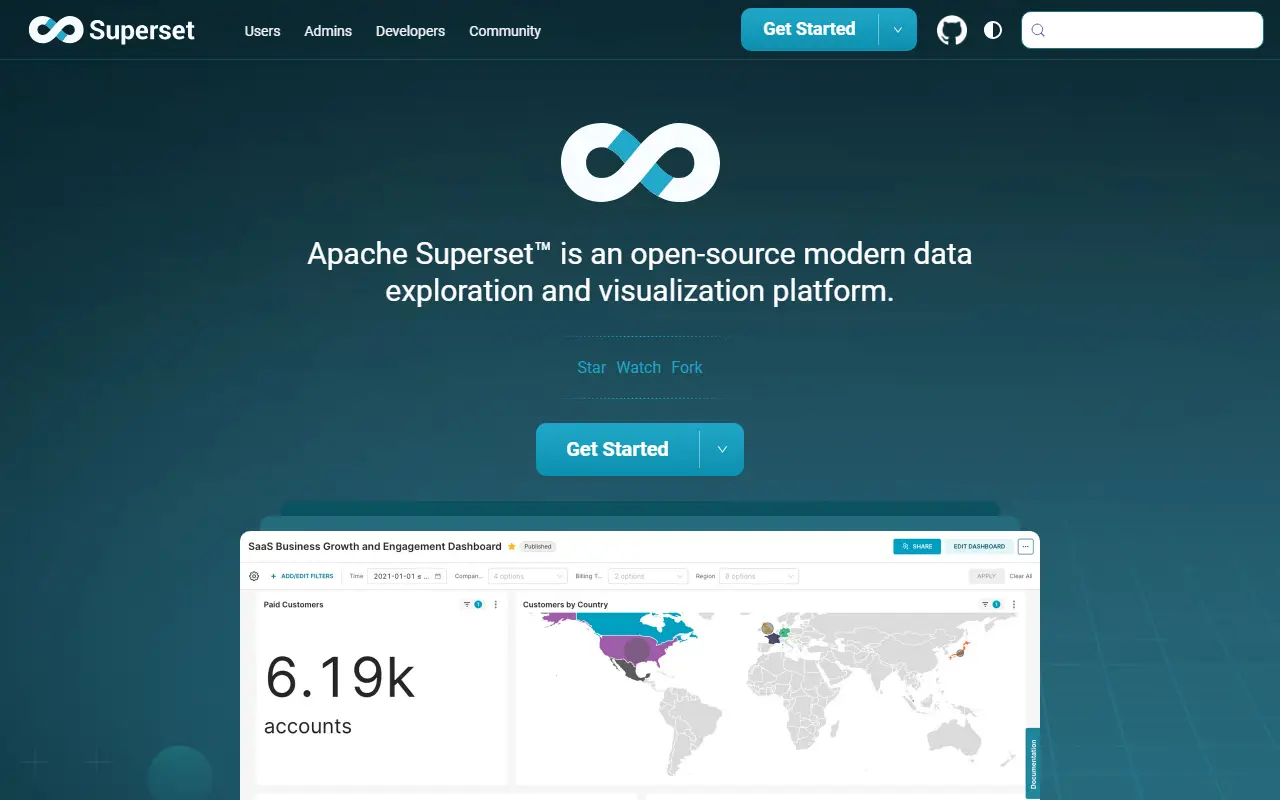
superset.apache.orgSuperset homepage screenshot

Apache Superset is a data exploration and visualization platform that runs as a web application. Analysts and business users can connect it to a database, build charts without code, assemble them into dashboards and share them, so it can augment or replace proprietary business intelligence tools for many teams.

The no-code chart builder sits next to a web-based SQL editor for advanced queries, and a lightweight semantic layer lets teams define reusable dimensions and metrics. Visualizations range from simple bar charts to geospatial views. Superset can query any SQL datastore or engine provided a matching Python database driver and SQLAlchemy dialect exist, including Presto, Trino and Athena. A configurable caching layer reduces database load, and security roles and authentication options are extensible.

The stack is Python with Flask on the back end and React on the front end, under the Apache-2.0 license. A REST API and extension framework allow programmatic control and customization. Documentation is split into guides for users, administrators and developers, and it is a typical choice for organizations that want a self-managed BI layer.

Key features

  • No-code chart builder
  • Web-based SQL editor
  • Shareable interactive dashboards
  • Lightweight semantic layer for metrics
  • Connects to any SQL database with a driver
  • Caching layer and security roles
  • REST API for programmatic customization

Pricing: Free and open source under the Apache-2.0 license.

Metabase

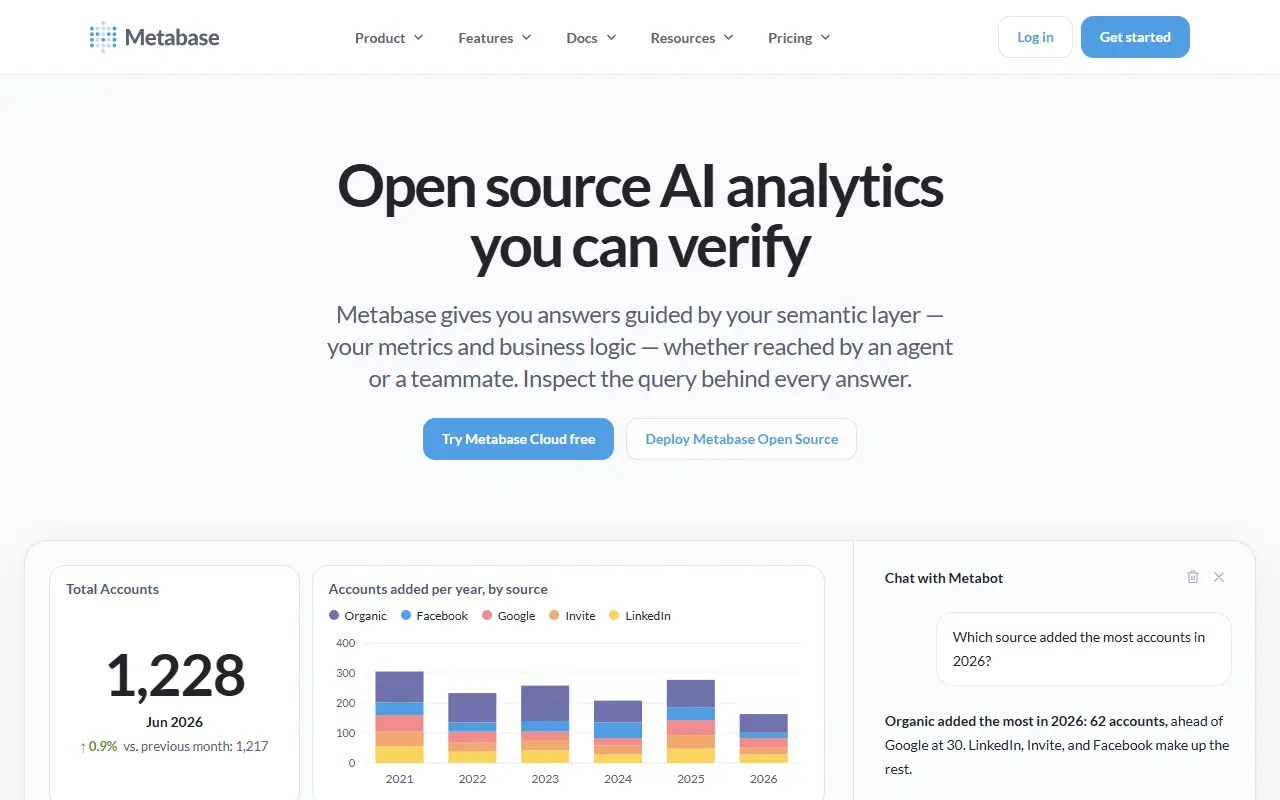
An open-source BI and embedded analytics tool for exploring data, building dashboards and asking questions without SQL, self-hosted or through Metabase Cloud.

GitHub stars
50k
Last commit
today
Latest release
v0.63.19
Self-hosted
Yes
Hosted version
Available
metabase.comMetabase homepage screenshot

Metabase is an open-source business intelligence and embedded analytics tool meant for everyone in a company, not only analysts. People can ask questions about their data without knowing SQL, while an SQL editor is available for more complex queries. Written in Clojure, it connects to databases such as PostgreSQL and MySQL.

Its features include interactive dashboards with filters, auto-refresh and custom click behavior, plus documents for long-form analysis that colleagues can comment on. An AI assistant called Metabot helps answer questions and write queries, and you can build your own AI agent against your data. Data Studio supports transforming raw data into analytics-ready tables and defining canonical metrics. Alerts and scheduled dashboard subscriptions go to email, Slack or a webhook, and a Library plus Git integration help version your work.

Metabase can also be embedded in your own product with components for charts, dashboards, a data browser and AI chat, and granular permissions work for internal teams and embedded customers. You can self-host it or use Metabase Cloud, which the project says includes support, backups, upgrades and a free trial. The repository license is listed as 'Other', so review its terms.

Key features

  • Question builder that needs no SQL
  • SQL editor for complex queries
  • Interactive dashboards with filters and auto-refresh
  • Alerts and scheduled subscriptions to email or Slack
  • Embedding of charts and dashboards in apps
  • Granular permissions for teams and customers
  • Metabot AI assistance for queries

Pricing: The open-source edition is free. Cloud Starter is $100 per month and Pro $575 per month with a 14-day trial; extra users cost $6 or $12 per month. Enterprise starts at $20,000 per year.

Cube

An open-source, headless semantic layer where you define metrics and access rules once in code and expose them to BI tools, apps and AI agents through SQL, REST and GraphQL.

GitHub stars
21k
Last commit
today
Latest release
v1.7.48
Self-hosted
Yes
Hosted version
Available
cube.devCube homepage screenshot

Cube Core is an open-source semantic layer. You describe your metrics, dimensions, joins and permissions a single time, as code, and Cube exposes that model through SQL, REST and GraphQL APIs to whatever sits downstream: BI tools, custom applications or AI agents. It is headless, meaning it ships no user interface of its own, which leaves you free to design the analytics experience your product needs.

The project argues that every BI tool already relies on a semantic layer to hide data complexity, but most are proprietary and tied to a single platform. Cube aims to make that layer reusable. It connects to any SQL data source, including warehouses such as BigQuery, Snowflake and Databricks, engines such as Amazon Athena and Presto, and application databases such as Postgres. A built-in relational caching engine delivers fast responses and high concurrency for API requests.

The core is written in Rust and JavaScript, and its license is listed as 'Other' on GitHub, so review the terms for commercial use. Cube can be self-hosted, and the company also offers Cube Cloud. It suits data teams building embedded analytics or wanting consistent metric definitions across tools.

Key features

  • Metrics and dimensions defined as code
  • SQL, REST and GraphQL APIs
  • Headless design with no built-in UI
  • Connects to Snowflake, BigQuery and Databricks
  • Built-in caching engine
  • Access rules for governed data

Pricing: Free forever plan for hobby projects. Starter costs $40 and Premium $80 per developer per month; Enterprise is custom via a demo request.

Lightdash

Lightdash is an open-source BI platform that defines metrics as code, with dashboards, AI agents and data apps built on a shared context layer.

GitHub stars
6.2k
Last commit
today
Latest release
2.423.2
Self-hosted
Yes
Hosted version
Available
lightdash.comLightdash homepage screenshot

Lightdash is an open-source business intelligence platform that it describes as agentic BI, meant for data teams that want analytics to be shipped like software. Metrics, joins, permissions, business logic and caching are defined once in a context layer, and that layer feeds MCP, SDKs, embedded analytics, data apps, AI agents and dashboards.

Analytics can be built as code: metrics, charts and dashboards live as files that you can edit with coding agents, preview from the Lightdash CLI, validate in CI and review in pull requests. Business users can pose questions in plain English, browse dashboards or build custom data apps, all while governance stays in place. Agents answer from the context layer rather than guessing from raw tables, respect permissions and return queries that can be inspected. The repository topics mention dbt.

Lightdash is written in TypeScript. The vendor recommends starting with Lightdash Cloud, which needs no infrastructure to run, and also offers a live demo, documentation and a sales call. The repository lists its licence as other, so check the terms before self-hosting.

Key features

  • Context layer for metrics and permissions
  • BI as code with CLI and CI validation
  • AI agents that answer from governed metrics
  • Dashboards and custom data apps
  • Embedded analytics, SDKs and MCP
  • dbt-based workflow

Pricing: Self-hosted Open Source edition with community support. Cloud Pro is $3000 per month with unlimited users and a 21-day trial; Enterprise is quoted.

Chartbrew

Chartbrew is an open-source reporting platform that turns data from APIs, SQL and NoSQL databases into live dashboards and embeddable charts.

GitHub stars
4.1k
Last commit
4 days ago
Latest release
v5.3.2
Self-hosted
Yes
Hosted version
Available
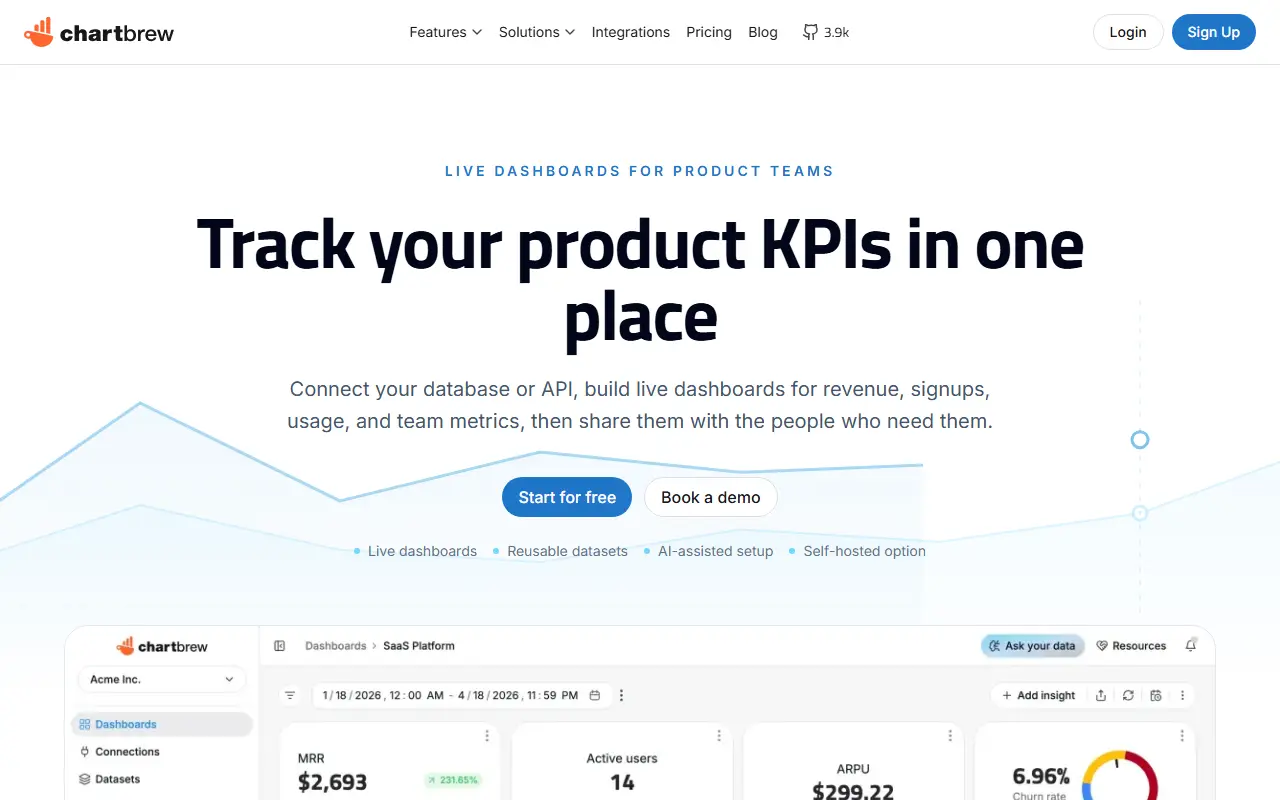
chartbrew.comChartbrew homepage screenshot

Chartbrew is an open-source web application that connects directly to databases and APIs and uses the data to build charts and dashboards. Its tools include a chart builder, editable dashboards, embeddable charts, a query and request editor and team features for sharing reports.

The platform also includes an AI assistant and scheduling, and its topics reference MySQL, PostgreSQL, MongoDB, Firestore and Firebase as data sources, with the latest list of supported sources on the project website. To self-host, the README lists Node.js 22 or newer, MySQL 5 or PostgreSQL 12.5 or newer, and Redis 6 or newer as prerequisites. The front end uses React and the back end Node.js.

A hosted Chartbrew service is available, and the repository license is listed as 'Other' on GitHub, so check the terms for your use. Chartbrew suits agencies, startups and teams who want shareable client dashboards without building a BI stack.

Key features

  • Chart builder and editable dashboards
  • Connects to APIs, SQL and NoSQL data
  • Charts that can be embedded
  • Query and request editor
  • AI assistant and scheduling
  • Team collaboration features

Pricing: No free cloud plan, but there is a 14-day trial and a free self-hosted option. Starter is $29, Growth $99 and Professional $299 per month, cheaper billed yearly; Enterprise is custom.

Graphic Walker

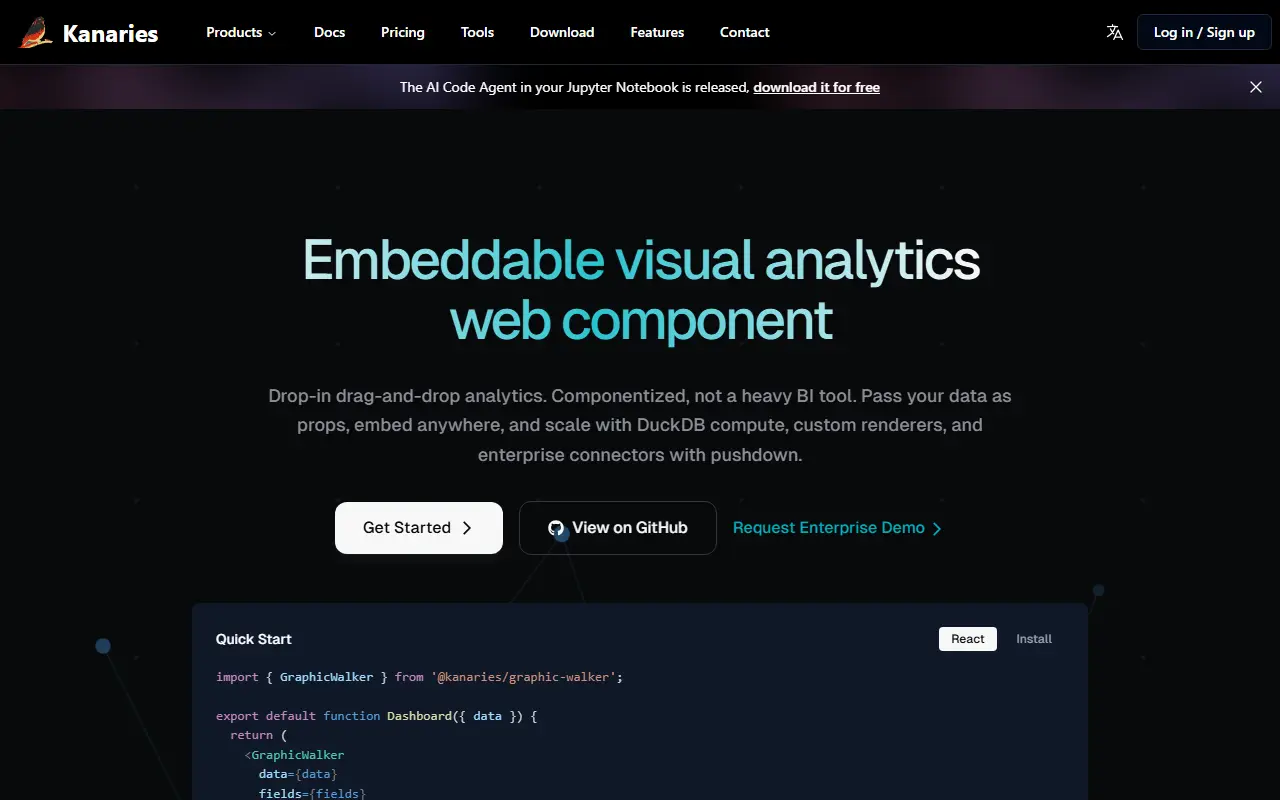
Embeddable open-source visual analytics component (Graphic Walker) that lets users explore data with drag-and-drop charts, offered as a lightweight Tableau alternative.

GitHub stars
3.3k
Last commit
yesterday
Latest release
v0.5.0
Licence
Apache-2.0
Self-hosted
Yes
kanaries.netGraphic Walker homepage screenshot

Graphic Walker, from Kanaries, is an open-source visual analytics tool positioned as an alternative to Tableau. Users build charts and pivot tables by dragging fields onto visual channels, and can also ask questions in natural language. It is released under the Apache-2.0 license.

Its main distinction is that it ships as a React component that you embed in your own application, rather than as a heavy business-intelligence platform. The interface follows a grammar of graphics based on Vega-Lite, supports spatial visualizations from GeoJSON and TopoJSON, and includes light and dark themes. A data explainer suggests why patterns occur, and a hand-writable chart specification called TerseSpec describes charts in compact form.

Computation can run in the browser using web workers, which allows a purely front-end setup, or queries can be passed to your own computation service, for example one using DuckDB as in the Python companion PyGWalker. It suits developers who want to add exploratory analysis to a product and data scientists who want fast visual exploration without a full BI stack.

Key features

  • Drag-and-drop chart building
  • Natural language query interface
  • Embeddable React component
  • Vega-Lite based grammar of graphics
  • Pivot table view
  • Browser-side computation with web workers
  • Spatial maps from GeoJSON and TopoJSON

Pricing: Free and open source under the Apache-2.0 license.
Saiku

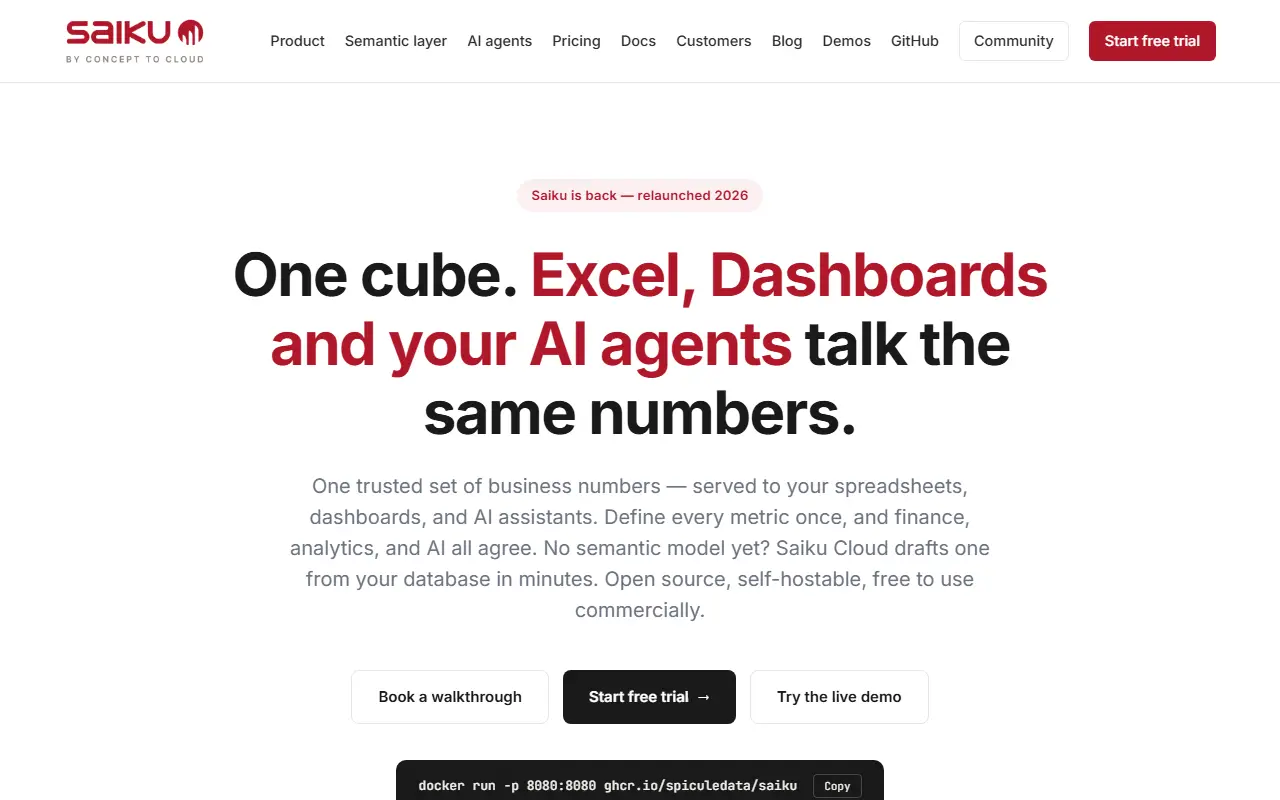
Saiku is an open-source semantic layer and OLAP analytics tool built on Mondrian and Apache Calcite, serving Excel, dashboards and AI agents.

GitHub stars
1.3k
Last commit
today
Latest release
v4.8.0
Licence
Apache-2.0
Self-hosted
Yes
saiku.biSaiku homepage screenshot

Saiku began in 2010 as an open-source OLAP browser for Mondrian and was rebuilt in 2026 as a modern semantic layer for analytics. It defines business cubes once and then exposes them to different consumers: a drag-and-drop browser interface, Excel through MDX and XMLA, dashboards, and AI agents through MCP.

In the browser, users drag fields onto rows, columns and filters and the application writes MDX for them. The back end uses a fork of Mondrian 4.8 with an Apache Calcite-based SQL planner, which can reach modern engines such as lakehouse systems. A typed REST interface allows AI agents to query data without handling MDX. A demo mode ships with a self-contained H2 database and the FoodMart sample cube.

Saiku is written in Java and licensed under Apache-2.0. It runs from a Docker image, which runs as a non-root user and requires setting an admin password for real deployments, and a hosted demo instance resets nightly. It suits analytics and BI teams that need governed, reusable metric definitions across spreadsheets, dashboards and AI tools.

Key features

  • Drag-and-drop OLAP browser
  • MDX and XMLA access from Excel
  • Mondrian with Apache Calcite SQL planner
  • MCP and typed REST API for AI agents
  • Docker image with demo mode
  • Support for modern lakehouse engines

Pricing: Free and open source under the Apache-2.0 licence.

Shaper

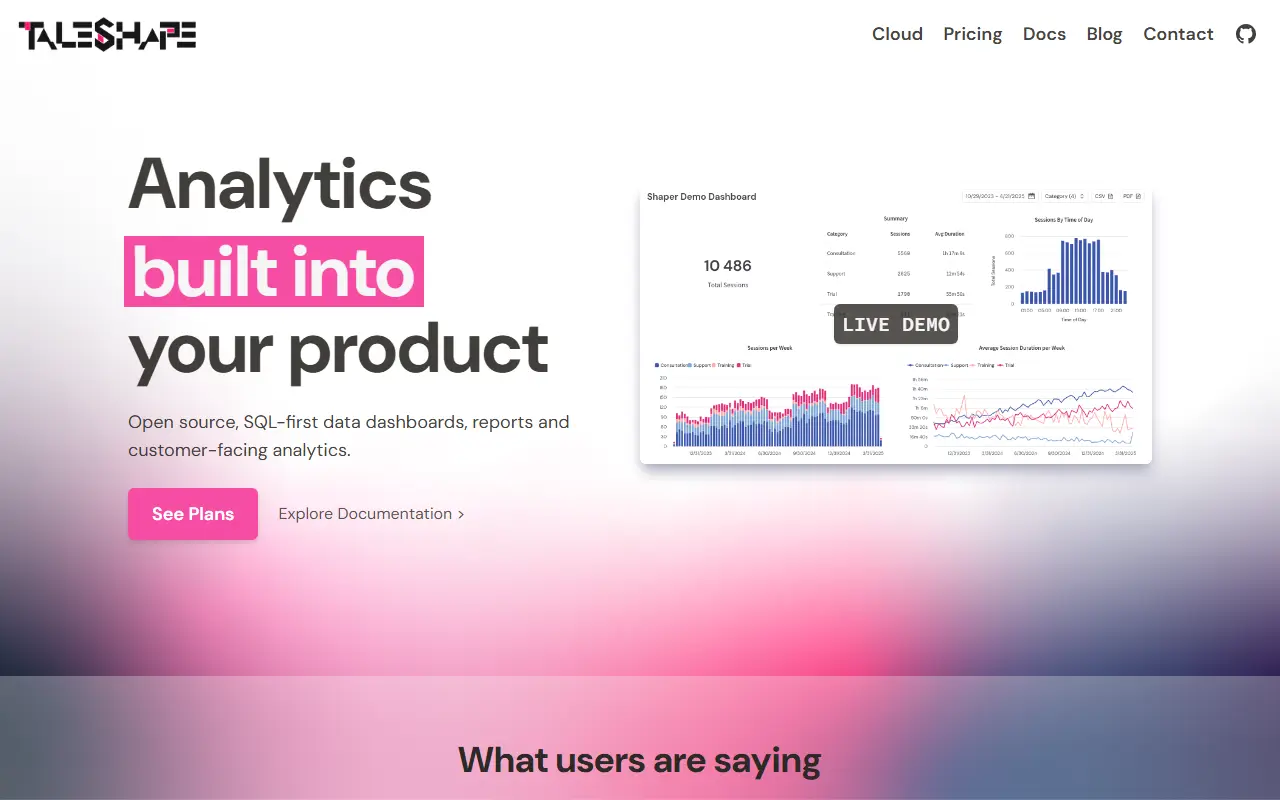
Shaper, from Taleshape, is a SQL-first tool for building dashboards, reports and embedded analytics on DuckDB, self-hosted or via managed hosting.

GitHub stars
1.3k
Last commit
3 days ago
Latest release
v0.24.12
Licence
MPL-2.0
Self-hosted
Yes
Hosted version
Available
taleshape.comShaper homepage screenshot

Shaper is an open-source tool for building data dashboards, reports and customer-facing analytics by writing SQL. It is developed by Taleshape and powered by DuckDB, and it aims to make analytics simple for developers: you write queries, and Shaper turns them into charts and shareable pages.

The data visualization side is SQL-first and designed to work with AI, with a Git-based workflow and the ability to query across data sources. Embedded analytics features include white-labeling and custom styles, row-level security through JWT tokens, and embedding via JavaScript and React SDKs without an iframe. Automated reporting can generate PDF, PNG, CSV and Excel files, send scheduled alerts and reports, and share password-protected links.

Shaper is written in Go and licensed under MPL-2.0. You can try it with a single Docker command or follow the deployment guide for production. Taleshape also offers managed hosting, in its own cloud or in your infrastructure, plus hands-on support, and explains the shared-responsibility model between self-hosting and managed service. It suits product teams adding analytics to their apps.

Key features

  • Dashboards written entirely in SQL
  • Powered by DuckDB
  • Embedding through JS and React SDKs
  • Row-level security with JWT tokens
  • PDF, PNG, CSV, and Excel report generation
  • Scheduled alerts and shareable links

Pricing: Core Shaper is free and self-managed. Managed Standard and Pro plans plus an Enterprise tier are offered, but the page shows no prices; the paid tiers are reached by joining the beta or booking a demo.

Datart

Datart is a free, Apache-licensed, open-source data visualization platform for building reports, dashboards and large-screen displays, created by the original Davinci BI team.

GitHub stars
2.3k
Last commit
1 yr ago
Licence
Apache-2.0
Self-hosted
Yes
running-elephant.github.ioDatart homepage screenshot

Datart is a data visualization platform built by the original creators of the Davinci BI project, aimed at enterprises that need to build reports, dashboards, large-screen displays and visual data applications. It positions itself as more open, adaptable and intelligent than typical closed business intelligence products, where users are limited to built-in data sources and chart types.

The platform's design centers on three principles: openness, achieved through standardized processes for managed visualization apps, standardized interactions such as filtering, drilling and linking between charts, and pluggable extension points at the data source, chart and visualization layers; integrability, so Datart can be embedded into other systems using its login, permissions and SDK integration points rather than only used as a standalone platform; and augmented analytics, aiming to go beyond showing what happened in the data toward explaining why, through extensible analytical capabilities.

Datart is written in TypeScript and React and uses chart libraries including ECharts and D3. It is released under the Apache-2.0 license, with a public demo, deployment and quick-start guides, and an active community supported through issue tracking and a WeChat discussion group.

Key features

  • Reports, dashboards and large-screen visualizations
  • Pluggable data source, chart and visualization extensions
  • Standardized filtering, drilling and linking interactions
  • Embeddable via SDK into third-party systems
  • SQL editor for data queries
  • ECharts and D3-based charting

Pricing: Free and open source under the Apache-2.0 license.

Sisense alternatives: questions

What is the best open-source alternative to Sisense?
Superset is the top-ranked open-source alternative to Sisense on Enlisted: A web-based business intelligence platform from the Apache project with a no-code chart builder, SQL editor and dashboards that connects to most SQL databases. Other strong options are Metabase, Cube, Lightdash and Chartbrew.
Are these Sisense alternatives free?
All 9 are open source, so the code is free to use under its licence, and all of them can be self-hosted on your own server or computer. 5 also offer a paid or managed cloud version if you'd rather not host it yourself.
How is this list of Sisense alternatives ranked?
By a score built from GitHub stars, star growth over the last 30 days and how recently the code changed. 8 of these projects shipped code in the last 30 days. Data is refreshed daily, and nobody can pay to move up.

People also look for alternatives to…

View all