#1
A CNCF metrics monitoring system and time series database that scrapes targets, evaluates alert rules and offers the PromQL query language.
- GitHub stars
- 68k
- Last commit
- yesterday
- Latest release
- v3.16.0
- Licence
- Apache-2.0
- Self-hosted
- Yes
prometheus.io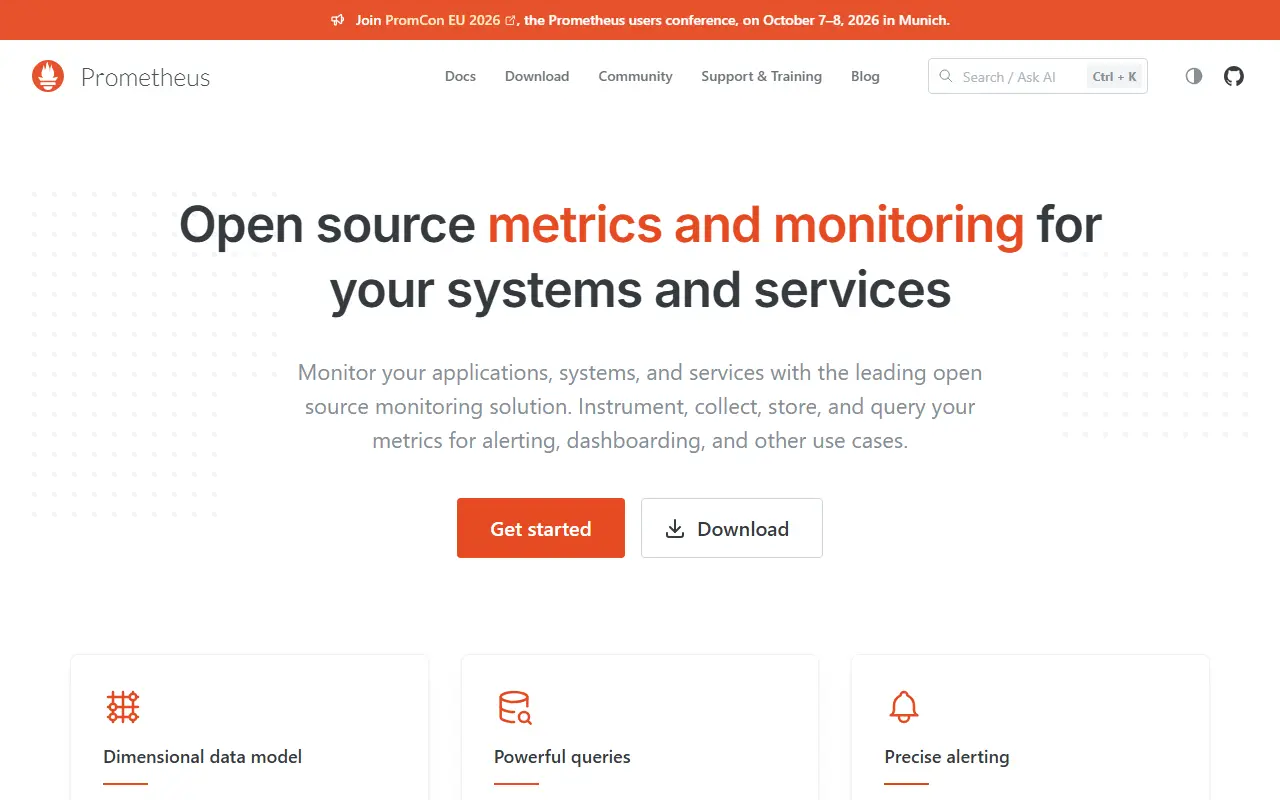
Prometheus is a systems and service monitoring tool and time series database, and a project of the Cloud Native Computing Foundation. It collects metrics from configured targets at set intervals, evaluates rule expressions, shows the results and can fire alerts when conditions are met.
Its data model is multi-dimensional: a time series is identified by a metric name plus key and value labels, and PromQL is the query language built to exploit that structure. Collection uses an HTTP pull model, with a gateway available for pushing metrics from short-lived batch jobs, and targets are found through service discovery or static configuration. Single server nodes are autonomous with no dependence on distributed storage, and hierarchical and horizontal federation is supported.
Prometheus is written in Go under the Apache-2.0 license and ships as precompiled binaries and Docker images on Quay.io and Docker Hub, or can be built from source. It has no hosted service of its own and is typically run next to exporters and a dashboarding tool such as Grafana, which suits cloud-native and Kubernetes environments.
Key features
- Multi-dimensional time series data model
- PromQL query language
- HTTP pull-based metric collection
- Service discovery for targets
- Alerting rules evaluated on collected metrics
- Federation across Prometheus servers
- Push gateway for batch jobs
Pricing: Free and open source under the Apache-2.0 license.
#2
An OpenTelemetry-native observability platform combining logs, traces, metrics, exceptions, session replay and AI tracing, self-hosted or in the cloud.
- GitHub stars
- 1.8k
- Last commit
- today
- Latest release
- cli/v2.0.11
- Licence
- MIT
- Self-hosted
- Yes
- Hosted version
- Available
tracewayapp.com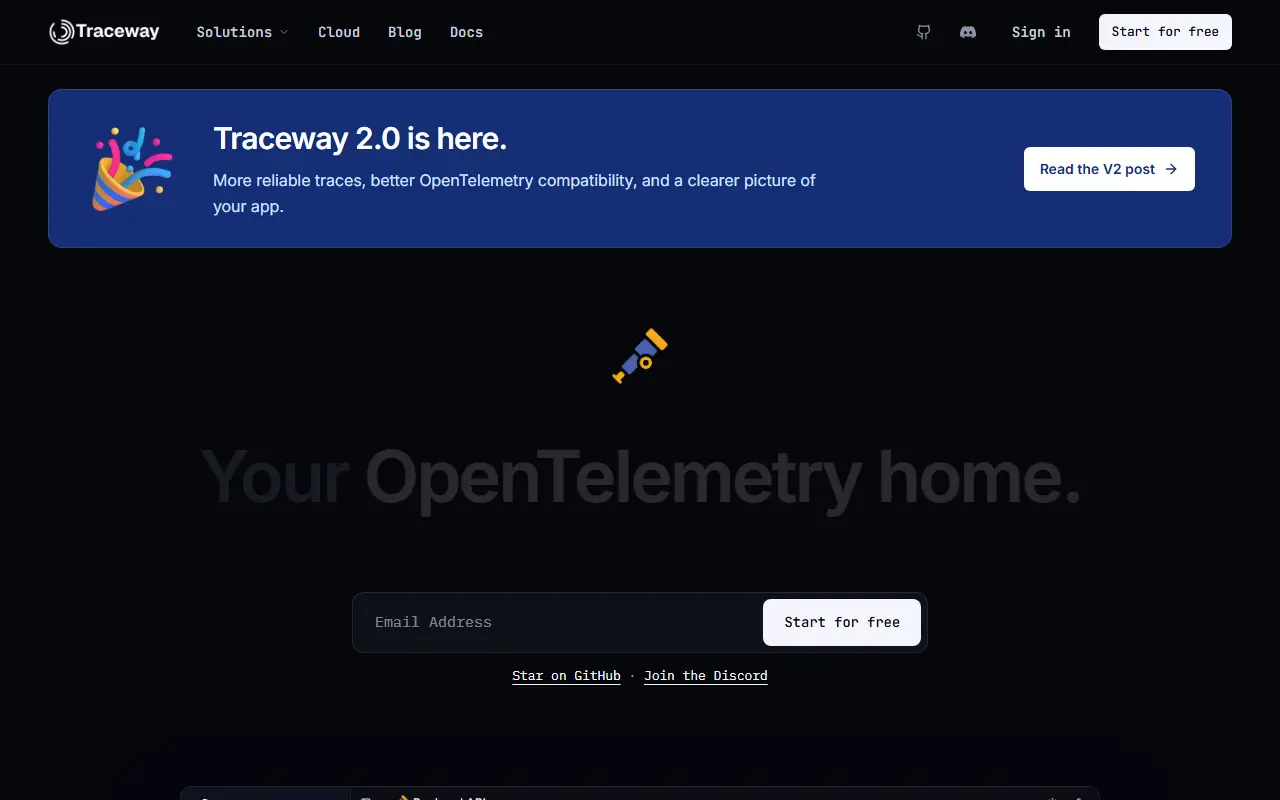
Traceway is an observability platform built natively on OpenTelemetry. It brings logs, traces, metrics, exception tracking, session replay, AI tracing and on-call paging into one product, and you can start by pointing an OTLP exporter at it without a separate collector or a vendor-specific SDK for each language.
Logs are structured and linked to traces, so you can jump from a log line to its span. Traces show end-to-end waterfalls, endpoint views rank routes by latency percentiles and error rate, and exceptions are grouped into ranked issues with source map support. There is experimental profiling with flame graphs, session replay for web and Flutter apps, and LLM observability covering cost, tokens and latency.
The project is written in Go, licensed under MIT and says that every feature ships in the open-source build with no open-core split. You can self-host it for free, using a setup the README says takes about 90 seconds, or run it on Traceway Cloud if you prefer not to manage infrastructure. It suits engineering teams looking for one tool to find and diagnose production problems.
Key features
- Structured logs linked to traces
- End-to-end distributed tracing waterfalls
- Grouped exception tracking with source maps
- Session replay for web and Flutter
- LLM cost and latency observability
- On-call paging and alerting
Pricing: Free to self-host under the MIT licence with all features included; a hosted Traceway Cloud option is also available.
#3
An open-source platform for visualizing metrics, logs and traces from many data sources, with dashboards, alerting and ad-hoc exploration.
- GitHub stars
- 78k
- Last commit
- today
- Latest release
- v13.3.1
- Licence
- AGPL-3.0
- Self-hosted
- Yes
- Hosted version
- Available
grafana.com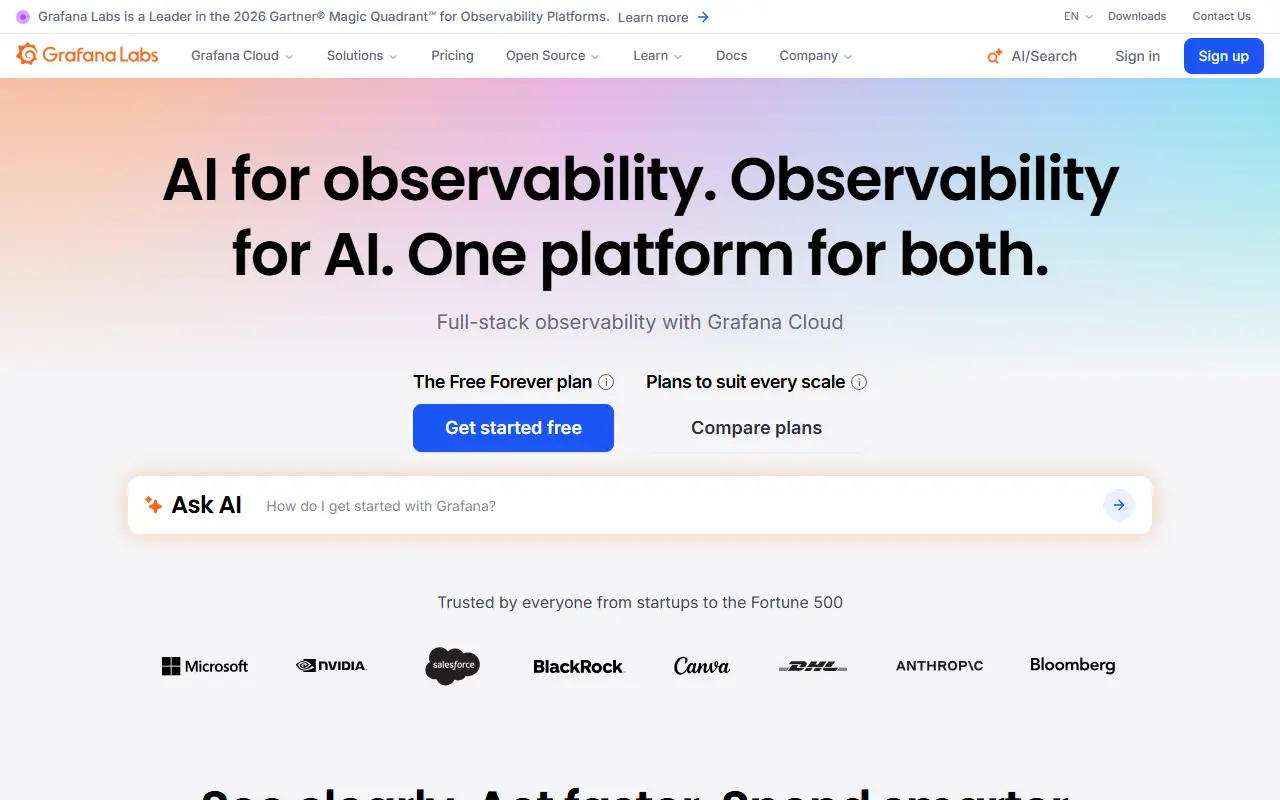
Grafana is a visualization and observability platform that lets you query, chart and alert on data wherever it is stored. It does not hold your data itself; it connects to sources such as Prometheus, Loki, Elasticsearch, InfluxDB, MySQL and PostgreSQL and brings their results together in shared dashboards.
Dashboards can be made reusable with template variables that appear as dropdowns, and a single graph may mix queries against different data sources. Explore views support ad-hoc queries, side-by-side comparison of time ranges and a jump from metrics to logs while keeping label filters. Alert rules are defined visually, and notifications go to systems like Slack, PagerDuty, VictorOps and OpsGenie. Panel plugins add further visualization types.
Grafana is AGPL-3.0 licensed, written in Go and TypeScript, and can be installed on your own servers; Grafana Labs also runs a hosted offering. It is common in DevOps and SRE teams as the dashboard layer on top of Prometheus-style monitoring, and a public demo site lets you try it first.
Key features
- Dashboards with template variables
- Mixed data sources in a single graph
- Visual alert rules with Slack and PagerDuty
- Explore view for ad-hoc metric and log queries
- Panel plugins for extra visualizations
- Connects to Prometheus, Loki and SQL databases
Pricing: Grafana Cloud has an always-free tier with usage limits. Pro starts at $19 per month plus usage; Enterprise starts at a $25,000 annual spend commit and is sold through sales.
#4
An open-source infrastructure monitoring platform that collects per-second metrics with little configuration and adds machine-learning anomaly detection and alerting.
- GitHub stars
- 81k
- Last commit
- today
- Latest release
- v2.12.3
- Licence
- GPL-3.0
- Self-hosted
- Yes
- Hosted version
- Available
netdata.cloud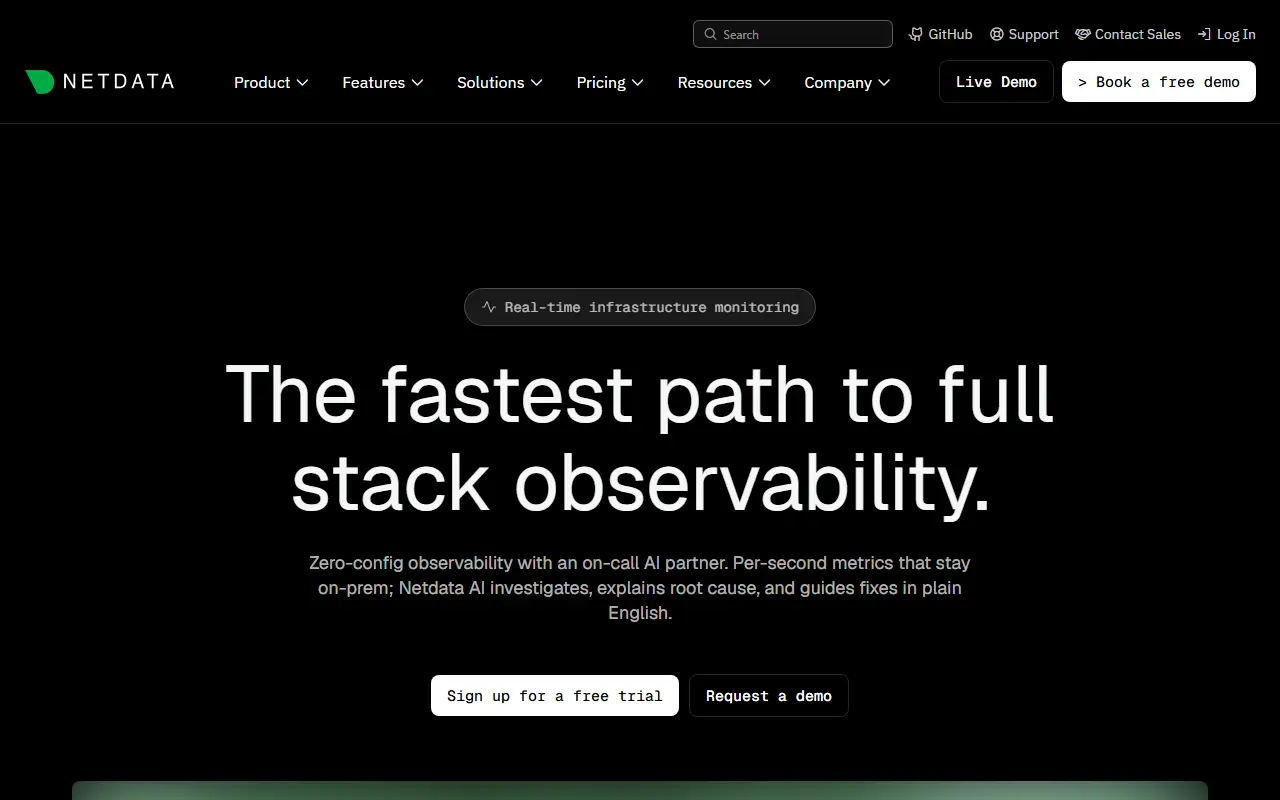
Netdata is a real-time infrastructure monitoring platform. You install an agent on servers, containers or Kubernetes nodes and it starts collecting metrics every second, showing them on dashboards without lengthy setup. Its origin story is a frustration with monitoring tools that offered few metrics at low resolution and cost too much to run.
The project highlights zero-configuration deployment, machine-learning-based anomaly detection and automated analysis, and an efficient agent that uses few resources. Data stays distributed on the monitored machines instead of being shipped to one central store. Integrations cover databases such as MySQL, PostgreSQL and MongoDB, plus Docker and Kubernetes, and the topics list mentions export paths to Prometheus, Grafana and InfluxDB. Netdata also advertises AI-assisted troubleshooting and an MCP interface.
The agent is GPL-3.0 licensed and written largely in Go, and Netdata Cloud offers a hosted layer for viewing many nodes together. It suits operations teams and lean engineering groups that want deep visibility quickly rather than building a metrics stack from several separate tools.
Key features
- Per-second metrics for servers and containers
- Zero-configuration agent deployment
- Machine-learning anomaly detection
- Alerting on infrastructure issues
- Database, Docker and Kubernetes monitoring
- Distributed storage that keeps data local
Pricing: The agent is free and Community covers up to 5 nodes. Homelab costs $90 per year for unlimited nodes and Business $4.50 per node per month billed annually.
#5
A cloud-native observability platform covering logs, metrics, traces, RUM and LLM monitoring, with Parquet columnar storage on S3 and a pitch against Datadog and Splunk.
- GitHub stars
- 23k
- Last commit
- today
- Latest release
- v1.2.0-rc2
- Licence
- AGPL-3.0
- Self-hosted
- Yes
- Hosted version
- Available
openobserve.ai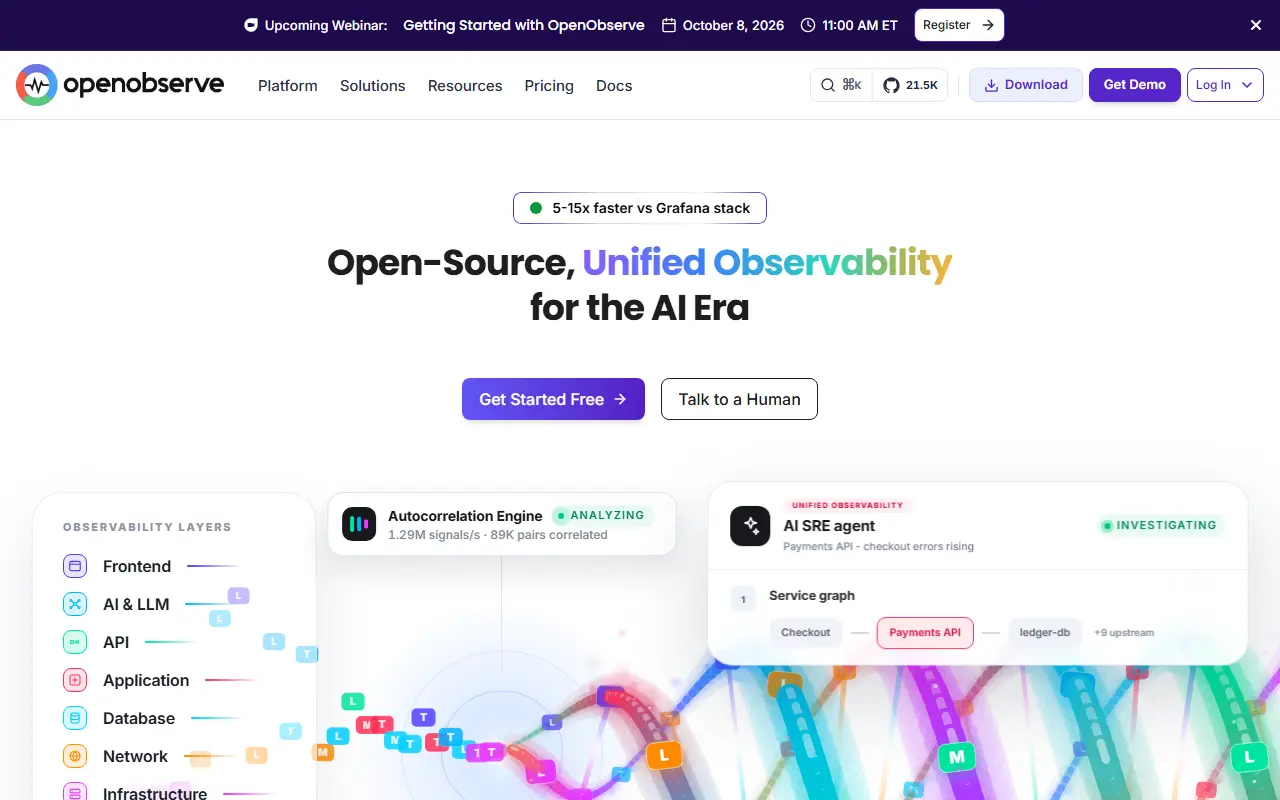
OpenObserve, often shortened to O2, is open-source observability software spanning logs, metrics, traces and analytics, real user monitoring on web, Android and iOS, session replay, pipelines, SLOs and AI and LLM observability. It is pitched as a lower-cost option next to Datadog, Splunk and Elasticsearch for teams that want complete observability without the complexity or price.
Its architecture uses Parquet columnar storage and an S3-native design, which the project says can cut storage costs by up to 140 times compared with Elasticsearch, with petabyte-scale capacity. Topics reference OpenTelemetry, Prometheus, Jaeger and Kibana, showing the standards and tools it interoperates with. The README has sections on architecture, comparisons, production readiness, security and compliance, and an enterprise edition.
OpenObserve is AGPL-3.0 licensed, with a hosted cloud option and a self-hosted deployment, and documentation and a Slack community are provided. It suits engineering teams looking to consolidate logging, metrics and tracing in one tool while keeping storage costs under control.
Key features
- Logs, metrics and traces in one platform
- Real user monitoring and session replay
- LLM and AI observability
- Parquet columnar storage on S3
- OpenTelemetry and Prometheus compatibility
- Pipelines and SLO tracking
Pricing: Self-hosting is free. Cloud is pay-as-you-go at $0.50 per GB ingested plus $0.01 per GB queried, with unlimited users and a 14-day trial; Enterprise is custom.
#6
An open-source observability platform built on OpenTelemetry that unifies APM, logs, metrics, traces, alerts and dashboards in one tool, self-hosted or in the cloud.
- GitHub stars
- 33k
- Last commit
- today
- Latest release
- v0.149.0
- Self-hosted
- Yes
- Hosted version
- Available
signoz.io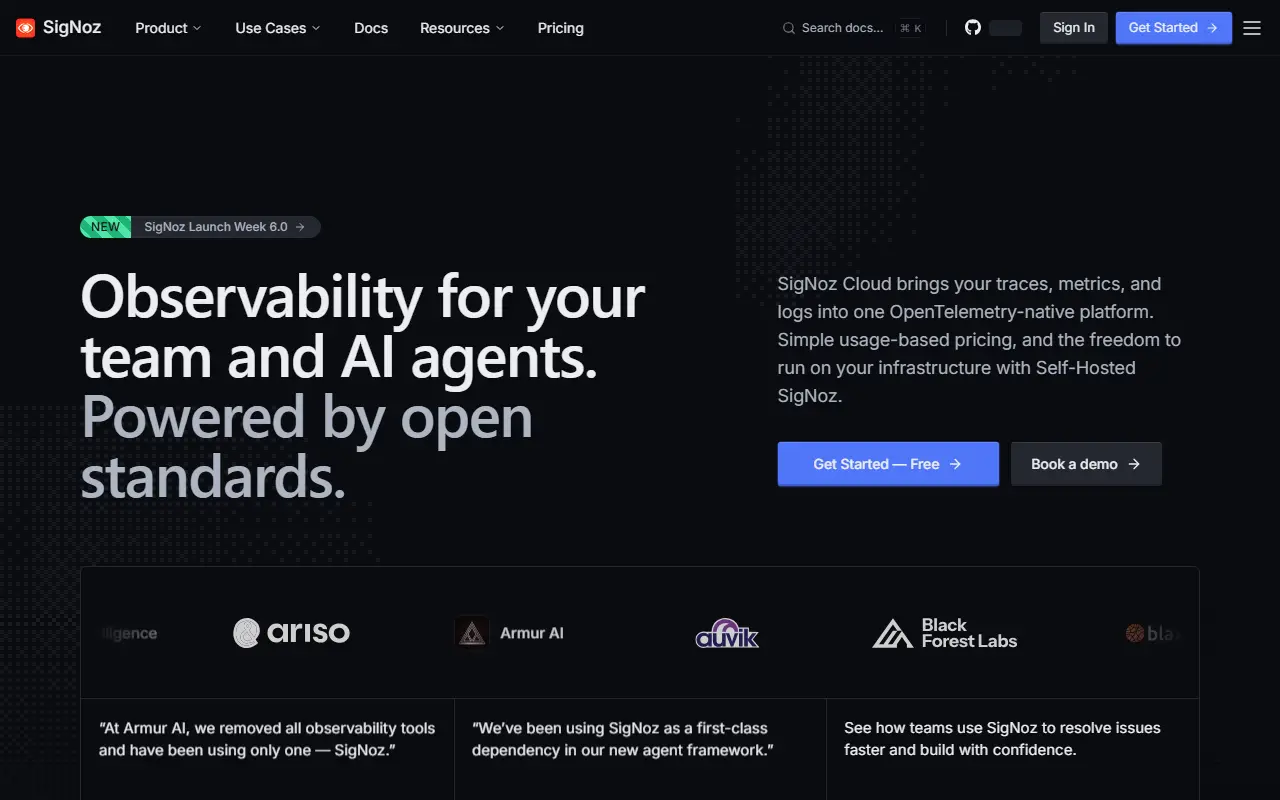
SigNoz is an observability platform, open source and built on OpenTelemetry. It aims to replace a fragmented monitoring stack with a single place for logs, metrics, traces, alerts, exceptions and dashboards, and it presents itself as useful for both engineering teams and their AI agents.
The APM view follows how each service performs, covering latency, error rate, throughput, Apdex, the busiest endpoints, and calls to databases and external services. Log management supports ingesting, searching and correlating logs with traces and metrics through a visual query builder. Dashboards can be built with a query builder, PromQL or ClickHouse SQL, infrastructure monitoring covers Kubernetes clusters, pods, nodes and host resources, and LLM and AI observability traces prompts, tool calls, tokens, latency and cost.
You can choose how to run it. SigNoz Cloud is fully managed, with a 30-day free trial and usage-based pricing that starts at $49. Enterprise options cover cloud, bring-your-own-cloud and self-hosted deployments with extra support and controls. The free Community edition runs in your own infrastructure via Docker, Kubernetes or Linux. The repository license is listed as 'Other' on GitHub.
Key features
- OpenTelemetry-native logs, metrics and traces
- APM with latency, error rate and Apdex
- Log management with a visual query builder
- Dashboards via query builder, PromQL or SQL
- Kubernetes infrastructure monitoring
- LLM and AI application observability
- Alerts and exception tracking
Pricing: Self-hosted Community is free. SigNoz Cloud Teams starts at $49 per month including $49 of usage, then usage-based per GB; Enterprise is custom and starts at $4000 per month.
#7
Grafana Loki is a horizontally scalable log aggregation system that indexes labels instead of log contents, inspired by Prometheus.
- GitHub stars
- 29k
- Last commit
- yesterday
- Latest release
- v3.7.9
- Licence
- AGPL-3.0
- Self-hosted
- Yes
- Hosted version
- Available
grafana.com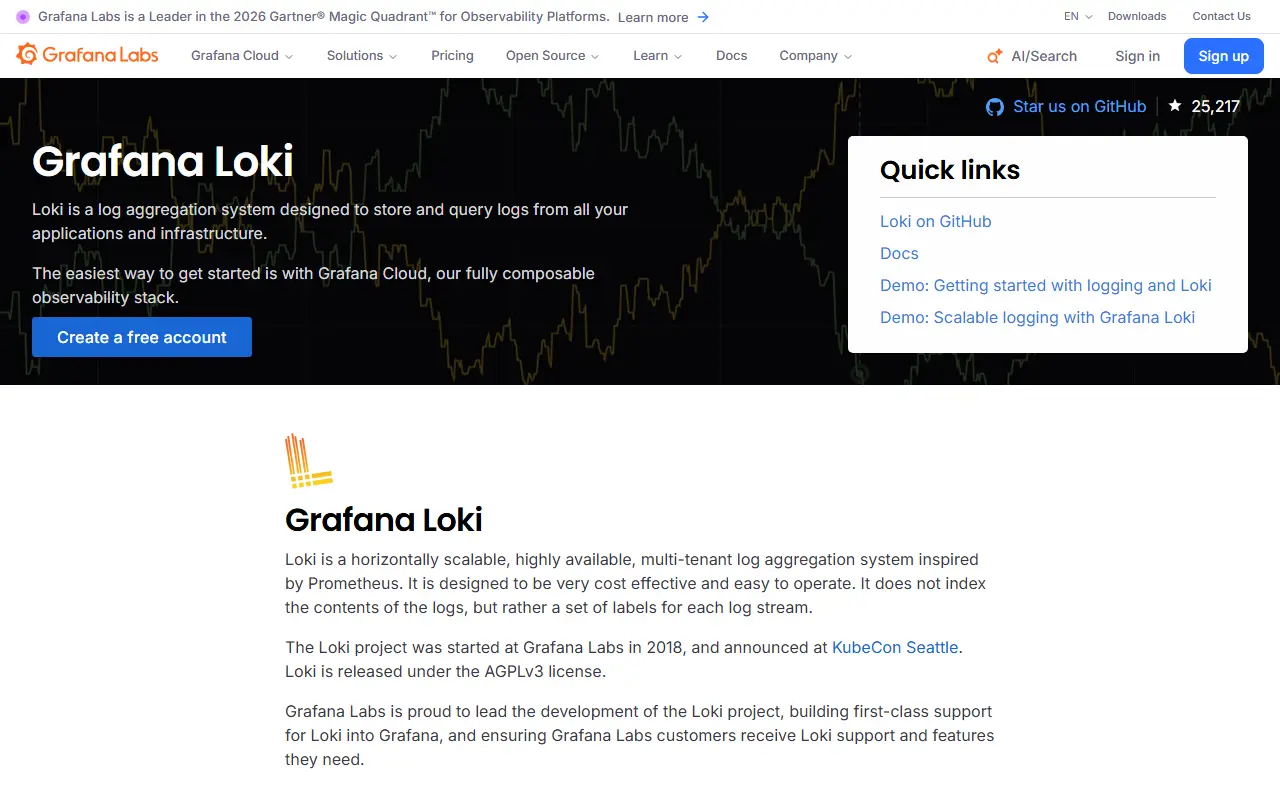
Loki is a log aggregation system from Grafana, described as Prometheus for logs. It is horizontally scalable, highly available and multi-tenant. Instead of indexing the contents of log lines, it indexes a set of labels for each log stream and stores the compressed log text, which the project says makes it simpler to operate and cheaper to run. It is written in Go and released under the AGPL-3.0 license.
Because Loki reuses the labels familiar from Prometheus, you can move between metrics and logs using the same label sets, and it has native support in Grafana. It works especially well for Kubernetes pod logs, since metadata such as pod labels is scraped and indexed automatically. A typical stack has three parts: Alloy as the collection agent, Loki for storage and queries, and Grafana for exploration. Alloy replaces Promtail, which is considered feature complete. Unlike Prometheus, Loki receives logs by push.
Key features
- Label-based indexing instead of full-text indexing
- Horizontally scalable, multi-tenant architecture
- Native Grafana integration for querying logs
- Automatic Kubernetes pod label indexing
- Grafana Alloy agent for log collection
- Single-binary deployment option
Pricing: Free and open source under the AGPL-3.0 license.
#8
A scalable time series database and monitoring solution that is compatible with the Prometheus ecosystem, available as single-node and cluster versions.
- GitHub stars
- 18k
- Last commit
- yesterday
- Latest release
- v1.156.0
- Licence
- Apache-2.0
- Self-hosted
- Yes
- Hosted version
- Available
victoriametrics.com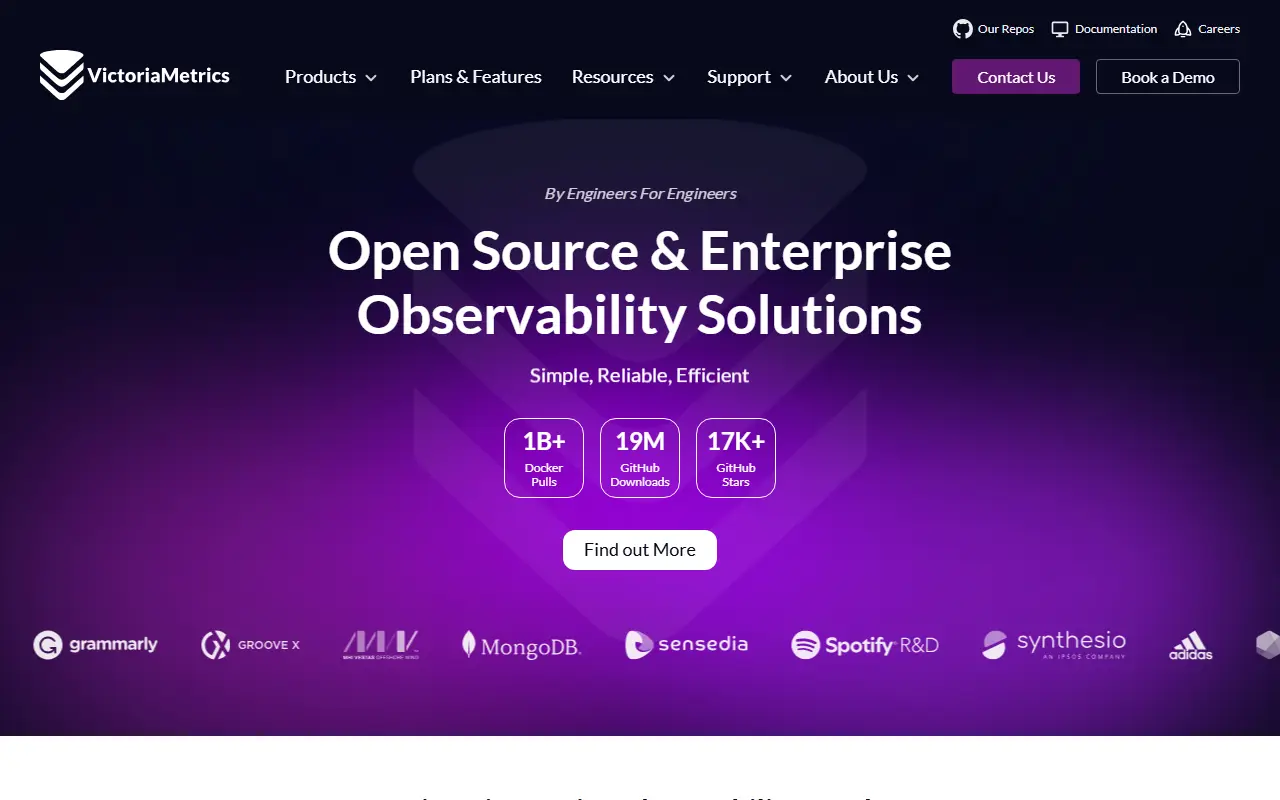
VictoriaMetrics is a monitoring solution and time series database built for performance, cost efficiency and scale. It stores metrics, works with the Prometheus ecosystem and query language, and its topics also list support for InfluxDB, Graphite and OpenTSDB data formats, along with Grafana for dashboards, which makes it a common drop-in backend for existing monitoring setups.
It is offered as a single-node version and a cluster version, both under the Apache License 2.0, with downloadable binaries, container images published to Docker Hub and Quay, and the source code. The project publishes case studies from well-known companies, a quick start and key concepts guide, community channels on Slack, X and YouTube, and a fast-moving changelog. Enterprise support and enterprise releases with long-term support are available, and they can be evaluated with a free trial license. The maintainers also mention security certifications for their development practices.
Written in Go, VictoriaMetrics suits platform and SRE teams that want to store large volumes of metrics efficiently, replacing or extending Prometheus long-term storage. It can be deployed on your own infrastructure, including Kubernetes, and the company offers a managed cloud service as well.
Key features
- Time series database for metrics
- Prometheus and PromQL compatibility
- Single-node and cluster versions
- Docker images and binary releases
- Enterprise releases with long-term support
- Integrations with Grafana and OpenTelemetry
Pricing: Single-node and cluster versions are free under Apache-2.0; enterprise support and releases are offered with a free trial license.
#9
Jaeger is a distributed tracing platform, originally from Uber and now a graduated CNCF project, for monitoring and troubleshooting microservices.
- GitHub stars
- 23k
- Last commit
- 2 days ago
- Latest release
- v2.23.0
- Licence
- Apache-2.0
- Self-hosted
- Yes
jaegertracing.io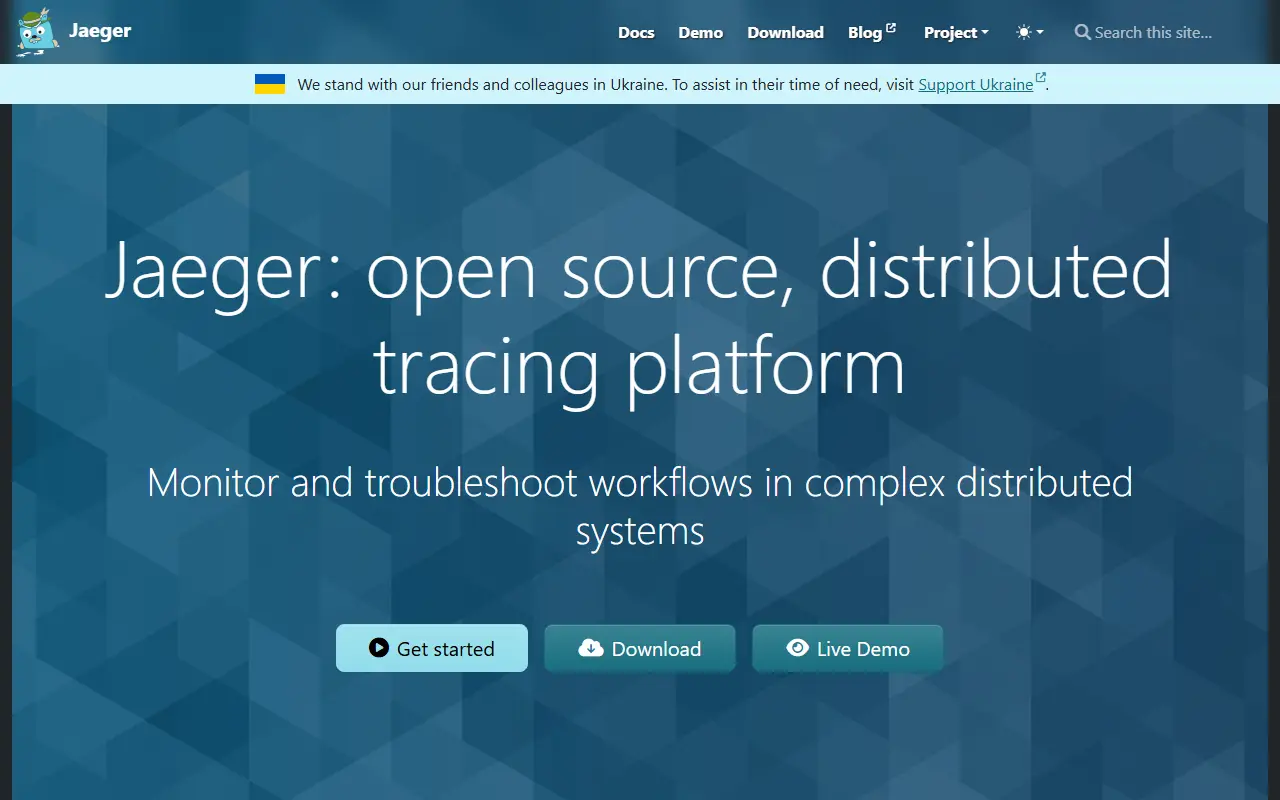
Jaeger is a tracing system for distributed applications, created at Uber Technologies and donated to the Cloud Native Computing Foundation, where it graduated in October 2019. It records how requests flow through services so teams can monitor and troubleshoot distributed systems. It is written in Go and released under the Apache-2.0 license. The README announces Jaeger v2.
A Docker-based quick start gets a local instance running in seconds, while the documentation covers production deployments and operations. Because Jaeger reuses many components from the OpenTelemetry Collector, the project works to keep configuration compatible between releases and publishes deprecation guidelines for when options change. It is an open project with open governance, welcoming contributions that do not always require code. The repository topics include distributed tracing, observability and OpenTelemetry, and community support runs on Slack.
Key features
- Distributed tracing for microservices
- Built on OpenTelemetry Collector components
- Docker quick start for local use
- Version compatibility guidelines
- CNCF graduated project
- Open governance and community channels
Pricing: Free and open source under the Apache-2.0 license.
#10
Scalable IT monitoring system for infrastructure and applications across physical, virtual, container, and cloud environments, with a free open-source Community edition.
- GitHub stars
- 2.6k
- Last commit
- today
- Licence
- GPL-2.0
- Self-hosted
- Yes
checkmk.com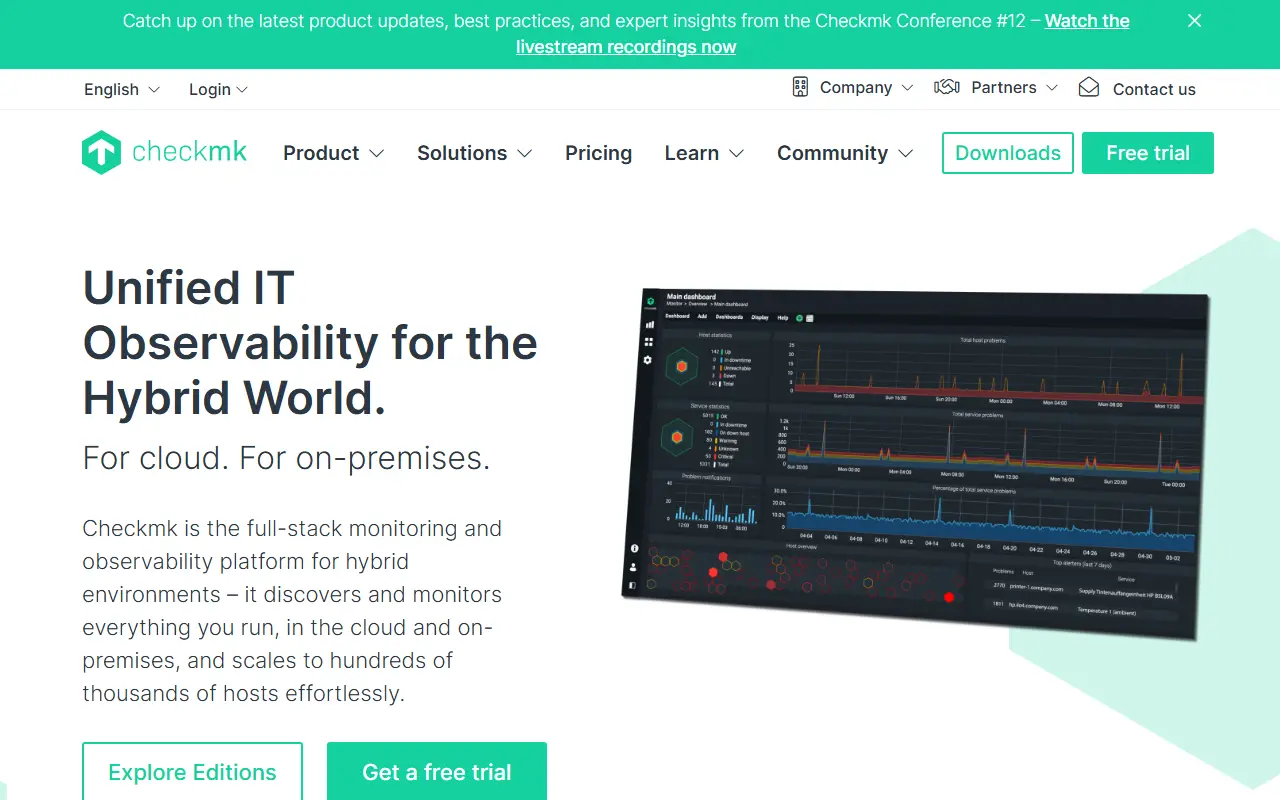
Checkmk is a comprehensive IT monitoring system designed for scalability, flexibility, and low resource consumption. It monitors infrastructure and applications across physical servers, virtual machines, containers, and cloud environments. It is written mainly in Python.
The Checkmk Community edition is free and open source under the GNU GPL v2. It includes the core monitoring engine, a web-based interface, agent-based and agentless monitoring, and support for hundreds of official and community plugins, and is suited to smaller environments with basic automation, dashboarding, and support needs. Commercial editions extend it: Pro adds distributed monitoring, built-in dashboards, automated agent management, enterprise integrations such as LDAP and REST APIs, and professional support, and Ultimate adds enhanced monitoring for dynamic cloud-native environments such as Kubernetes, AWS, Azure, and GCP.
The website provides documentation, releases, and discussion forums, and a demo of the Pro edition can be downloaded for evaluation. Checkmk suits IT operations teams and managed service providers that want a single tool for servers, networks, and applications.
Key features
- Agent-based and agentless monitoring
- Web-based interface
- Hundreds of official and community plugins
- Distributed monitoring in the commercial Pro edition
- Cloud-native monitoring in the Ultimate edition
- Low resource consumption design
Pricing: The Community edition is free. Pro starts at €190 and Ultimate at €275 per month billed annually, with free trials; the Cloud (SaaS) edition is listed at €240 per month on monthly billing.
22 more Datadog alternatives
- View tool

Kibana
Monitoring & Observability
Your window into all of your data
OSSvs Splunk★ 21k
- View tool

Quickwit
Monitoring & Observability
Cloud-native OSS search engine for observability
Apache-2.0vs Datadog★ 12k
- View tool

HyperDX
Monitoring & Observability
Resolve production issues, fast. An open source observability platform unifying session re
MITvs Datadog★ 10k
- View tool

Pinpoint
Monitoring & Observability
APM, (Application Performance Management) tool for large-scale distributed systems.
Apache-2.0vs Dynatrace★ 14k
- View tool

OneUptime
Monitoring & Observability
Complete open-source monitoring and observability platform.
OSSvs Datadog★ 7.8k
- View tool

Zabbix
Monitoring & Observability
Real-time monitoring of IT components and services, such as networks, servers, VMs, applic
AGPL-3.0vs Datadog★ 6.6k
- View tool

Pyroscope
Monitoring & Observability
Continuous Profiling Platform. Debug performance issues down to a single line of code
AGPL-3.0vs Datadog★ 12k
- View tool

Coroot
Monitoring & Observability
Coroot is an open-source observability and APM tool with AI-powered Root Cause Analysis. I
Apache-2.0vs Datadog★ 8k
- View tool

Apache HertzBeat
Monitoring & Observability
AI-powered open source real-time monitoring system for metrics, logs, alerts, and observab
Apache-2.0vs Datadog★ 7.5k
- View tool

Highlight.io
Monitoring & Observability
Highlight gives your team full transparency into the errors, interactions, and performance
OSSvs Sentry★ 9.4k
- View tool

Graylog
Monitoring & Observability
Free and open log management
OSSvs Splunk★ 8.2k
- View tool

Kener
Monitoring & Observability
Stunning status pages, batteries included!
MITvs Atlassian Statuspage★ 5.2k
- View tool

Pixie
Monitoring & Observability
Instant Kubernetes-Native Application Observability
Apache-2.0vs Datadog★ 6.6k
- View tool

Uptrace
Monitoring & Observability
Open source APM: OpenTelemetry traces, metrics, and logs
AGPL-3.0vs Datadog★ 4.3k
- View tool

Zabbix
Monitoring & Observability
Official Zabbix Dockerfiles
AGPL-3.0vs Datadog★ 2.9k
- View tool

Odigos
Monitoring & Observability
Distributed tracing without code changes. 🚀 Instantly monitor any application using OpenT
Apache-2.0vs Datadog★ 3.7k
- View tool

Nagios Core
Monitoring & Observability
Nagios Core
GPL-2.0vs Datadog★ 2.1k
- View tool

Icinga 2
Monitoring & Observability
The core of our monitoring platform with a powerful configuration language and REST API.
GPL-3.0vs Datadog★ 2.2k
- View tool

Webfunny
Monitoring & Observability
【免费社区版】【企业版】Webfunny是一款集全链路监控和用户行为分析(埋点)系统于一体的大数据分析系统,我们致力于解决线上的疑难杂症和精细化分析业务数据;监控系统面向技术、埋点
Apache-2.0vs Sentry★ 5.3k
- View tool

ClickVisual
Monitoring & Observability
A lightweight log analytic and data visualize platform built on clickhouse.
MITvs Splunk★ 1.6k
- View tool

Riemann
Monitoring & Observability
A network event stream processing system, in Clojure.
EPL-1.0vs Datadog★ 4.3k
- View tool

Easy-Monitor
Monitoring & Observability
企业级 Node.js 应用性能监控与线上故障定位解决方案
BSD-2-Clausevs Dynatrace★ 3.1k
Commercial Datadog alternatives
Hosted, closed-source products that compete with Datadog. Showing 12 of 72.
- View tool

Amazon CloudWatch
Monitoring & Observability
AWS service for metrics, logs, alarms and dashboards
SaaS
- View tool

Honeycomb
Monitoring & Observability
Observability service for querying high-cardinality traces and events
SaaS
- View tool

Coralogix
Monitoring & Observability
Observability platform that analyzes logs, metrics and traces as they are ingested
SaaS
- View tool

Dynatrace
Monitoring & Observability
Full-stack observability with automatic instrumentation and AI-based root-cause analysis
SaaS
- View tool

LogicMonitor
Monitoring & Observability
Agentless hybrid infrastructure monitoring with automated device discovery
SaaS
- View tool

Splunk
Monitoring & Observability
Splunk is a data platform for security and observability that collects, searches and analyzes machine data to detect threats and prevent downtime.
SaaS
- View tool

AppDynamics
Monitoring & Observability
Cisco application performance monitoring that maps technical metrics to business impact
SaaS
- View tool

Sentry
Monitoring & Observability
Sentry is an error tracking and application performance monitoring platform that helps developers find, trace and fix problems in web, mobile and backend code.
SaaS
- View tool
Google Cloud Observability
Monitoring & Observability
Google Cloud logging, monitoring, tracing and error reporting services
SaaS
- View tool

Azure Monitor
Monitoring & Observability
Azure service for collecting and analyzing metrics, logs and traces
SaaS
- View tool

Groundcover
Monitoring & Observability
eBPF-based observability that keeps collected data inside the customer's cloud
SaaS
- View tool

Logz.io
Monitoring & Observability
Managed observability stack for logs, metrics and traces built on open tooling
SaaS
See every Datadog alternative on its tool page
Datadog alternatives: questions
- What is the best open-source alternative to Datadog?
- Prometheus is the top-ranked open-source alternative to Datadog on Enlisted: A CNCF metrics monitoring system and time series database that scrapes targets, evaluates alert rules and offers the PromQL query language. Other strong options are Traceway, Grafana, Netdata and OpenObserve.
- What are the best commercial alternatives to Datadog?
- Amazon CloudWatch, Honeycomb, Coralogix, Dynatrace and LogicMonitor are among the hosted, closed-source alternatives to Datadog listed on Enlisted, which lists 72 in total. Compare their pricing and features on each tool page.
- Are these Datadog alternatives free?
- All 32 are open source, so the code is free to use under its licence, and all of them can be self-hosted on your own server or computer. 11 also offer a paid or managed cloud version if you'd rather not host it yourself.
- How is this list of Datadog alternatives ranked?
- By a score built from GitHub stars, star growth over the last 30 days and how recently the code changed. 29 of these projects shipped code in the last 30 days. Data is refreshed daily, and nobody can pay to move up.
 TrackMedia
 TrackRev