
 Coralogix
 Axiom
Axiom AppSignal
 Chronosphere
 Observe
 Scout Monitoring
 Splunk Observability Cloud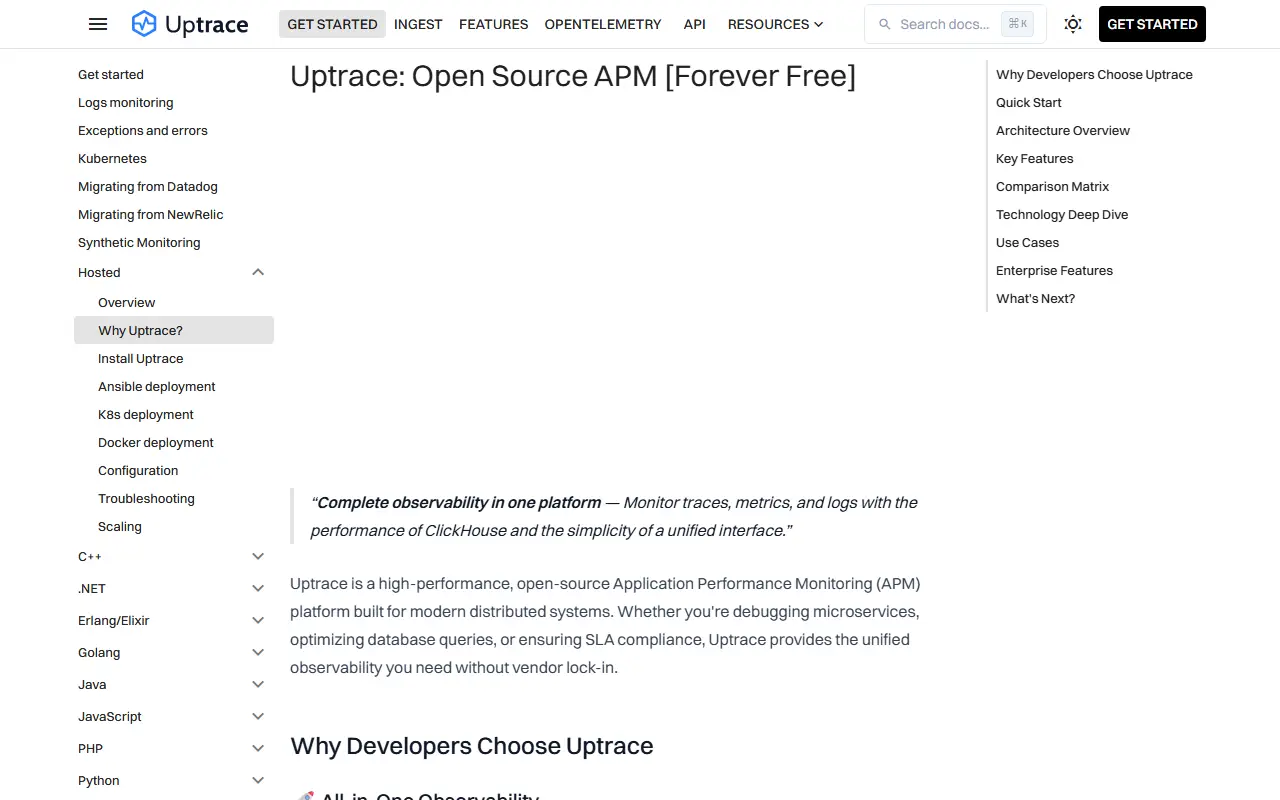
About Uptrace
Uptrace is an open-source application performance monitoring platform. It collects distributed traces, metrics and logs through OpenTelemetry and presents them in a single interface, so teams can monitor applications and troubleshoot problems without switching between separate tracing, metrics and logging tools.
The interface includes a query builder, a service graph, faceted filters, chart annotations and many prebuilt dashboards that appear automatically as metrics arrive. Alerting rules send notifications through email, Slack, WebHook or AlertManager. Data can be ingested via OpenTelemetry, Prometheus, Vector, FluentBit and CloudWatch, Grafana can use Uptrace as a Tempo or Prometheus data source, and single sign-on works through OpenID Connect.
Uptrace is written in Go with a Vue front end, stores telemetry in ClickHouse and keeps metadata such as alerts in PostgreSQL. It is licensed under AGPL-3.0 and can be self-hosted with Docker, and a cloud demo needs no login. The project says it is meant to cut monitoring costs, which suits engineering teams comparing self-hosted APM options with commercial observability suites.
Key features
- Unified view of traces, metrics, and logs
- Prebuilt dashboards created automatically
- Alert notifications via Email, Slack, and WebHook
- SQL-like query language for spans
- Grafana Tempo and Prometheus compatibility
- OpenID Connect single sign-on
Good fit for
- →Self-hosted APM for microservice teams
- →Troubleshooting slow requests with distributed traces
- →Centralizing OpenTelemetry data in one backend
- Tags
- apm
- opentelemetry
- tracing
- observability
- metrics
- logs
- clickhouse
- self-hosted
- monitoring
- go
Uptrace: questions and answers
- What is Uptrace used for?
- Uptrace is an open-source APM that combines OpenTelemetry traces, metrics and logs in one interface, backed by ClickHouse and PostgreSQL. It is a good fit for self-hosted APM for microservice teams, troubleshooting slow requests with distributed traces and centralizing OpenTelemetry data in one backend.
- Is Uptrace open source?
- Yes. Uptrace is open source under the AGPL-3.0 licence. Its source code is on GitHub at uptrace/uptrace and is written mainly in Go.
- Is Uptrace free?
- Yes. Uptrace is open source, so the software itself is free to use.
- Can I self-host Uptrace?
- Yes. Uptrace can be self-hosted on your own server or infrastructure.
- What is Uptrace an alternative to?
- Uptrace is an open-source alternative to Datadog, Honeycomb, Dynatrace and AppDynamics. Other open-source alternatives to Datadog include SigNoz, HyperDX and OpenObserve.
- Is Uptrace actively maintained?
- Yes. The most recent commit to Uptrace was on 13 August 2026, and the latest release is v2.1.0-beta.8, published on 13 August 2026. The project has 4.3k stars on GitHub.
Open-source alternatives to Uptrace
See all
SigNoz
Monitoring & Observability
SigNoz Cloud is a one-stop observability tool built on top of OpenTelemetry. Get APM, logs
OSSvs Datadog★ 32k
HyperDX
Monitoring & Observability
Resolve production issues, fast. An open source observability platform unifying session re
MITvs Datadog★ 9.9k
OpenObserve
Monitoring & Observability
High-performance, unified observability for the AI era. 140x lower storage cost.
AGPL-3.0vs Datadog★ 22k
Traceway
Monitoring & Observability
The only tool you need to know what is happening and how to fix it.
MITvs Datadog★ 1.6k
Coroot
Monitoring & Observability
Coroot is an open-source observability and APM tool with AI-powered Root Cause Analysis. I
Apache-2.0vs Datadog★ 7.9k
Grafana
Monitoring & Observability
The open and composable observability and data visualization platform. Visualize metrics,
AGPL-3.0vs Datadog★ 77k
SaaS alternatives to Uptrace
See all
Datadog
Monitoring & Observability
Datadog is a cloud monitoring and observability platform that brings metrics, logs and traces from applications, tools and services into one place.
SaaS
Honeycomb
Monitoring & Observability
Observability service for querying high-cardinality traces and events
SaaS
Dynatrace
Monitoring & Observability
Full-stack observability with automatic instrumentation and AI-based root-cause analysis
SaaS
AppDynamics
Monitoring & Observability
Cisco application performance monitoring that maps technical metrics to business impact
SaaS
New Relic
Monitoring & Observability
Observability platform for application performance, infrastructure and logs
SaaS
IBM Instana
Monitoring & Observability
Automated application performance monitoring for microservices and containers
SaaS