7,363 open-source and SaaS tools, with GitHub stats refreshed every day.

8 alternatives ranked by real activity

Open-source Honeycomb alternatives

A curated, ranked list of the 8 best open-source alternatives to Honeycomb.

The best open-source alternative to Honeycomb is SigNoz. If that doesn't suit you, other good options are Jaeger, OpenObserve, HyperDX and Highlight.io.

Honeycomb alternatives are mainly monitoring & observability tools. 7 of them shipped code in the last 30 days, 8 can be self-hosted, and 4 use a permissive licence.

Last updated October 2, 2026 · ranked by GitHub stars, growth and recent commits

SigNoz

An open-source observability platform built on OpenTelemetry that unifies APM, logs, metrics, traces, alerts and dashboards in one tool, self-hosted or in the cloud.

GitHub stars
32k
Last commit
today
Latest release
v0.144.0
Self-hosted
Yes
Hosted version
Available
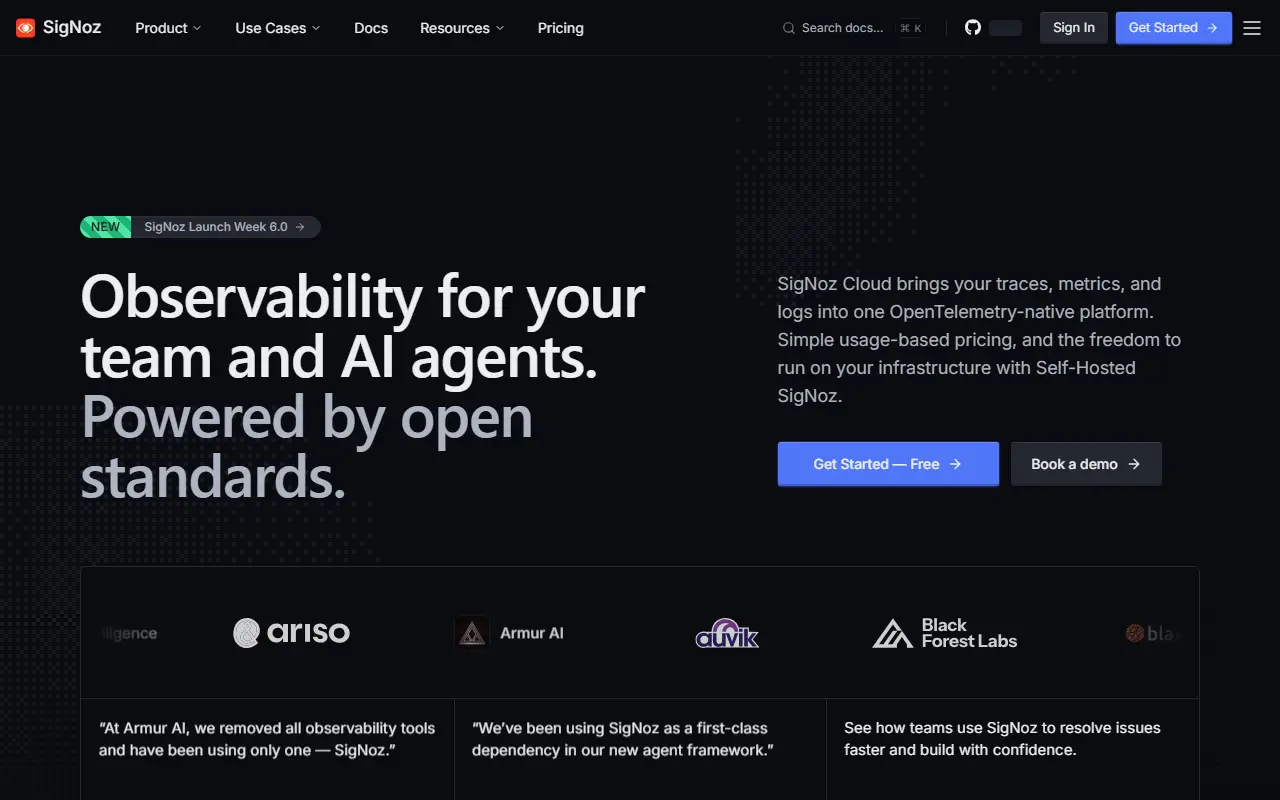
signoz.ioSigNoz homepage screenshot

SigNoz is an observability platform, open source and built on OpenTelemetry. It aims to replace a fragmented monitoring stack with a single place for logs, metrics, traces, alerts, exceptions and dashboards, and it presents itself as useful for both engineering teams and their AI agents.

The APM view follows how each service performs, covering latency, error rate, throughput, Apdex, the busiest endpoints, and calls to databases and external services. Log management supports ingesting, searching and correlating logs with traces and metrics through a visual query builder. Dashboards can be built with a query builder, PromQL or ClickHouse SQL, infrastructure monitoring covers Kubernetes clusters, pods, nodes and host resources, and LLM and AI observability traces prompts, tool calls, tokens, latency and cost.

You can choose how to run it. SigNoz Cloud is fully managed, with a 30-day free trial and usage-based pricing that starts at $49. Enterprise options cover cloud, bring-your-own-cloud and self-hosted deployments with extra support and controls. The free Community edition runs in your own infrastructure via Docker, Kubernetes or Linux. The repository license is listed as 'Other' on GitHub.

Key features

  • OpenTelemetry-native logs, metrics and traces
  • APM with latency, error rate and Apdex
  • Log management with a visual query builder
  • Dashboards via query builder, PromQL or SQL
  • Kubernetes infrastructure monitoring
  • LLM and AI application observability
  • Alerts and exception tracking

Pricing: Self-hosted Community is free. SigNoz Cloud Teams starts at $49 per month including $49 of usage, then usage-based per GB; Enterprise is custom and starts at $4000 per month.

Jaeger

Jaeger is a distributed tracing platform, originally from Uber and now a graduated CNCF project, for monitoring and troubleshooting microservices.

GitHub stars
23k
Last commit
yesterday
Latest release
v2.21.0
Licence
Apache-2.0
Self-hosted
Yes
jaegertracing.ioJaeger homepage screenshot

Jaeger is a tracing system for distributed applications, created at Uber Technologies and donated to the Cloud Native Computing Foundation, where it graduated in October 2019. It records how requests flow through services so teams can monitor and troubleshoot distributed systems. It is written in Go and released under the Apache-2.0 license. The README announces Jaeger v2.

A Docker-based quick start gets a local instance running in seconds, while the documentation covers production deployments and operations. Because Jaeger reuses many components from the OpenTelemetry Collector, the project works to keep configuration compatible between releases and publishes deprecation guidelines for when options change. It is an open project with open governance, welcoming contributions that do not always require code. The repository topics include distributed tracing, observability and OpenTelemetry, and community support runs on Slack.

Key features

  • Distributed tracing for microservices
  • Built on OpenTelemetry Collector components
  • Docker quick start for local use
  • Version compatibility guidelines
  • CNCF graduated project
  • Open governance and community channels

Pricing: Free and open source under the Apache-2.0 license.

OpenObserve

A cloud-native observability platform covering logs, metrics, traces, RUM and LLM monitoring, with Parquet columnar storage on S3 and a pitch against Datadog and Splunk.

GitHub stars
22k
Last commit
today
Latest release
v1.1.0-rc1
Licence
AGPL-3.0
Self-hosted
Yes
Hosted version
Available
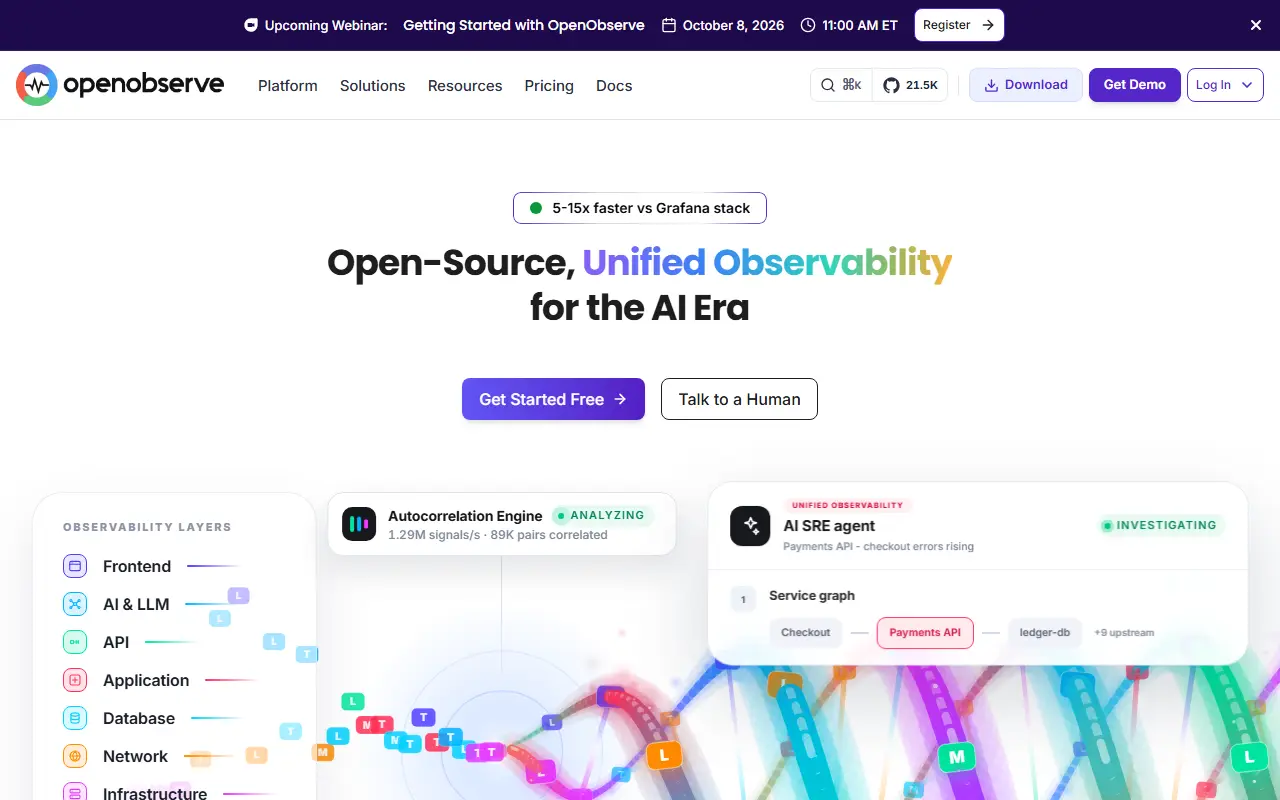
openobserve.aiOpenObserve homepage screenshot

OpenObserve, often shortened to O2, is open-source observability software spanning logs, metrics, traces and analytics, real user monitoring on web, Android and iOS, session replay, pipelines, SLOs and AI and LLM observability. It is pitched as a lower-cost option next to Datadog, Splunk and Elasticsearch for teams that want complete observability without the complexity or price.

Its architecture uses Parquet columnar storage and an S3-native design, which the project says can cut storage costs by up to 140 times compared with Elasticsearch, with petabyte-scale capacity. Topics reference OpenTelemetry, Prometheus, Jaeger and Kibana, showing the standards and tools it interoperates with. The README has sections on architecture, comparisons, production readiness, security and compliance, and an enterprise edition.

OpenObserve is AGPL-3.0 licensed, with a hosted cloud option and a self-hosted deployment, and documentation and a Slack community are provided. It suits engineering teams looking to consolidate logging, metrics and tracing in one tool while keeping storage costs under control.

Key features

  • Logs, metrics and traces in one platform
  • Real user monitoring and session replay
  • LLM and AI observability
  • Parquet columnar storage on S3
  • OpenTelemetry and Prometheus compatibility
  • Pipelines and SLO tracking

Pricing: Self-hosting is free. Cloud is pay-as-you-go at $0.50 per GB ingested plus $0.01 per GB queried, with unlimited users and a 14-day trial; Enterprise is custom.

HyperDX

An open-source observability platform that unifies logs, traces, metrics and session replays on top of ClickHouse and OpenTelemetry, a Kibana-style experience for ClickHouse.

GitHub stars
9.9k
Last commit
today
Latest release
cli-v0.6.4
Licence
MIT
Self-hosted
Yes
Hosted version
Available
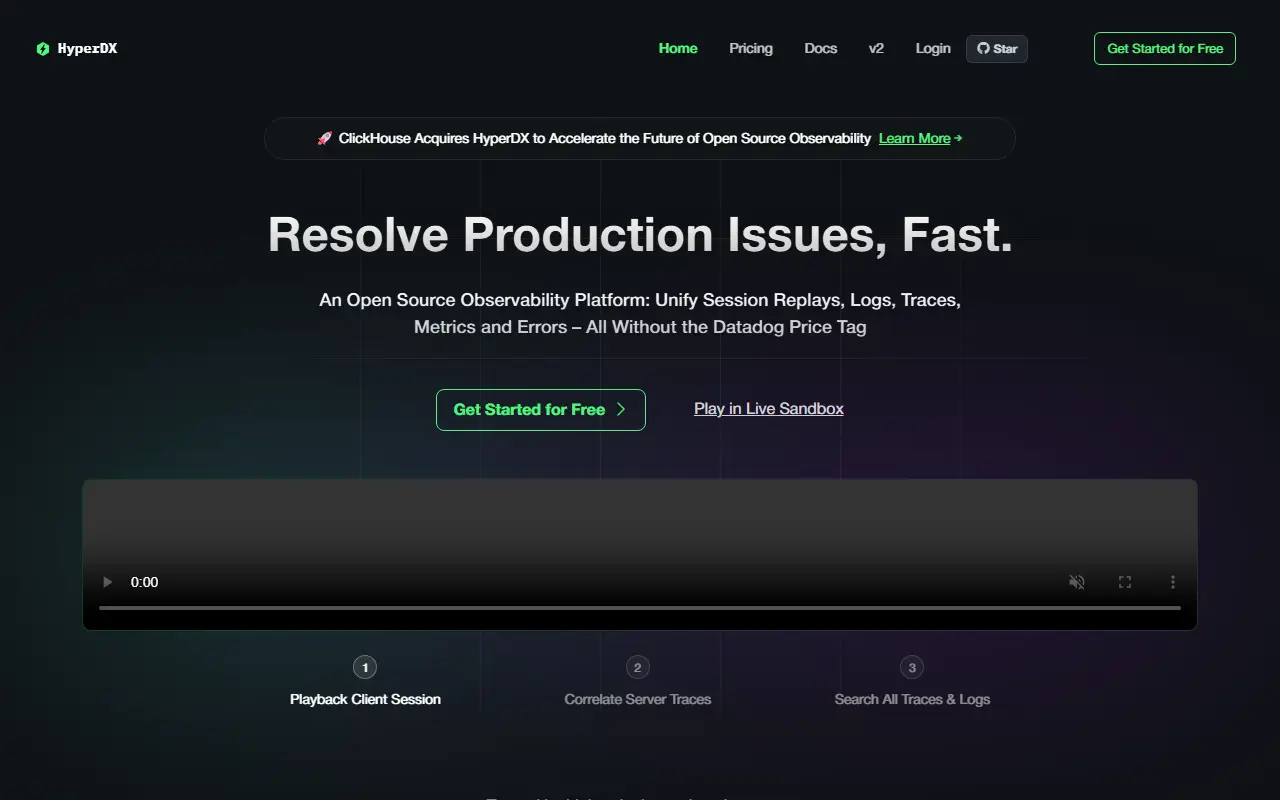
hyperdx.ioHyperDX homepage screenshot

HyperDX is an open-source observability platform for working out why production is broken. It brings logs, metrics, traces, errors and session replays into one place, and works as a search and visualization layer on top of ClickHouse and OpenTelemetry, which the authors compare to Kibana for ClickHouse. It is a core component of ClickStack.

It is schema agnostic and can sit on top of an existing ClickHouse schema. Searching uses full-text and property syntax such as level:err, with SQL as an option, events can be compared with event deltas, high-cardinality events can be charted on dashboards, and alerts can be set up in a few clicks. Live tail shows the newest logs and traces, JSON strings can be queried natively, OpenTelemetry works out of the box, and APM views cover HTTP requests down to database queries.

One deployment option is ClickStack, a bundle of ClickHouse, HyperDX, an OpenTelemetry Collector and MongoDB, and HyperDX can instead be pointed at your own ClickHouse instance. It can also be used with ClickHouse Cloud. The project is MIT licensed and written in TypeScript.

Key features

  • Unified logs, metrics, traces and session replays
  • Schema-agnostic search on ClickHouse
  • Full-text and property search syntax
  • Alerts and event delta analysis
  • Live tail for logs and traces
  • OpenTelemetry support out of the box
  • Dashboards for high-cardinality events

Pricing: Free plan stores up to 3 GB a month. Starter is $20 per month flat with 50 GB included and $0.40 per extra GB; Enterprise is custom. No per-seat or per-host billing.

Highlight.io

An open-source full-stack monitoring platform that combines session replay, error monitoring, logging and distributed tracing, offered hosted or self-hosted.

GitHub stars
9.4k
Last commit
yesterday
Latest release
docker-v0.5.6
Self-hosted
Yes
Hosted version
Available
app.highlight.ioHighlight.io homepage screenshot

Highlight, at highlight.io, is an open-source monitoring platform for developers. Its aim is to give teams one cohesive tool covering the front end and back end, instead of separate products for errors, logs and user sessions.

The core features are session replay, error monitoring and logging, with tracing and metrics also in scope. Console logs from the front end can be analyzed, and errors are embedded alongside the session in which they happened, so you can see what the user was doing beforehand. Session comments let teams discuss user frustration or bugs, there are integrations with other tools, and client SDKs install with a few lines of code.

You can sign up for the free-to-start hosted version at app.highlight.io, or deploy a hobby instance on Linux with Docker, sized at roughly 8 GB of memory, four CPUs and 64 GB of storage. The code is written in TypeScript and Go, and the repository lists the license as Other, so check the licence file for terms.

Key features

  • Session replay for user interactions
  • Error monitoring tied to sessions
  • Logging and console log analysis
  • Distributed tracing and metrics
  • Session comments for team discussion
  • Client SDKs for several platforms
  • Docker hobby self-hosting

Pricing: A hosted version is free to start; a hobby self-hosted instance is available. The repository lists the license as Other.

Coroot

An open-source observability and APM tool that uses eBPF to collect metrics, logs, traces and profiles automatically, with SLO alerting and AI-assisted root cause analysis.

GitHub stars
7.9k
Last commit
2 days ago
Latest release
v1.27.0
Licence
Apache-2.0
Self-hosted
Yes
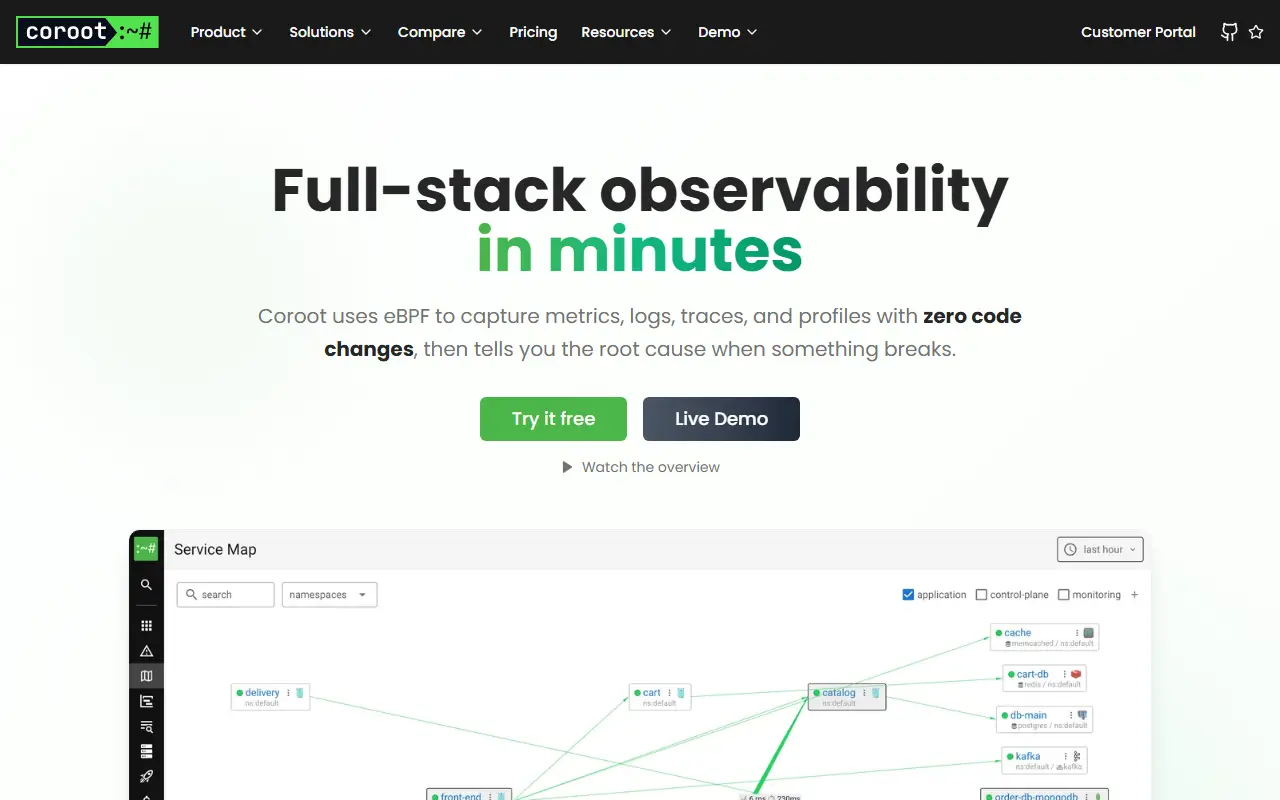
coroot.comCoroot homepage screenshot

Coroot is an open-source observability and application performance monitoring tool. Its pitch is that collecting metrics, logs and traces is not enough on its own, so it turns the data into actionable insights, including AI-powered root cause analysis, predefined inspections and a service map.

It gathers metrics, logs, traces and continuous profiles automatically with eBPF, so legacy and third-party services can be observed without code changes, and it is also vendor-neutral through OpenTelemetry instrumentation. Features include a service map, application health summaries, SLO tracking and alerting, distributed tracing, log pattern clustering with logs-to-traces correlation using ClickHouse, and one-click profiling that drills down to the line of code. Predefined inspections audit each application without configuration.

Coroot is written in Go and licensed under Apache-2.0, with a live demo, documentation and a separate Coroot Enterprise edition. Topics include database monitoring, microservices and Prometheus. It suits SRE and platform teams that want observability for Kubernetes and Linux workloads without manually instrumenting every service.

Key features

  • eBPF-based zero-instrumentation data collection
  • Service map of the whole system
  • SLO tracking and alerting
  • Distributed tracing with OpenTelemetry
  • Continuous profiling to the code line
  • Log pattern clustering
  • AI-powered root cause analysis

Pricing: Open-source Community Edition is free. Standard is $1 per monitored CPU core per month with a 14-day trial; Premium with 24x7 support is quoted by sales.

Uptrace

An open-source APM that combines OpenTelemetry traces, metrics and logs in one interface, backed by ClickHouse and PostgreSQL.

GitHub stars
4.3k
Last commit
1 mo ago
Latest release
v2.1.0-beta.8
Licence
AGPL-3.0
Self-hosted
Yes
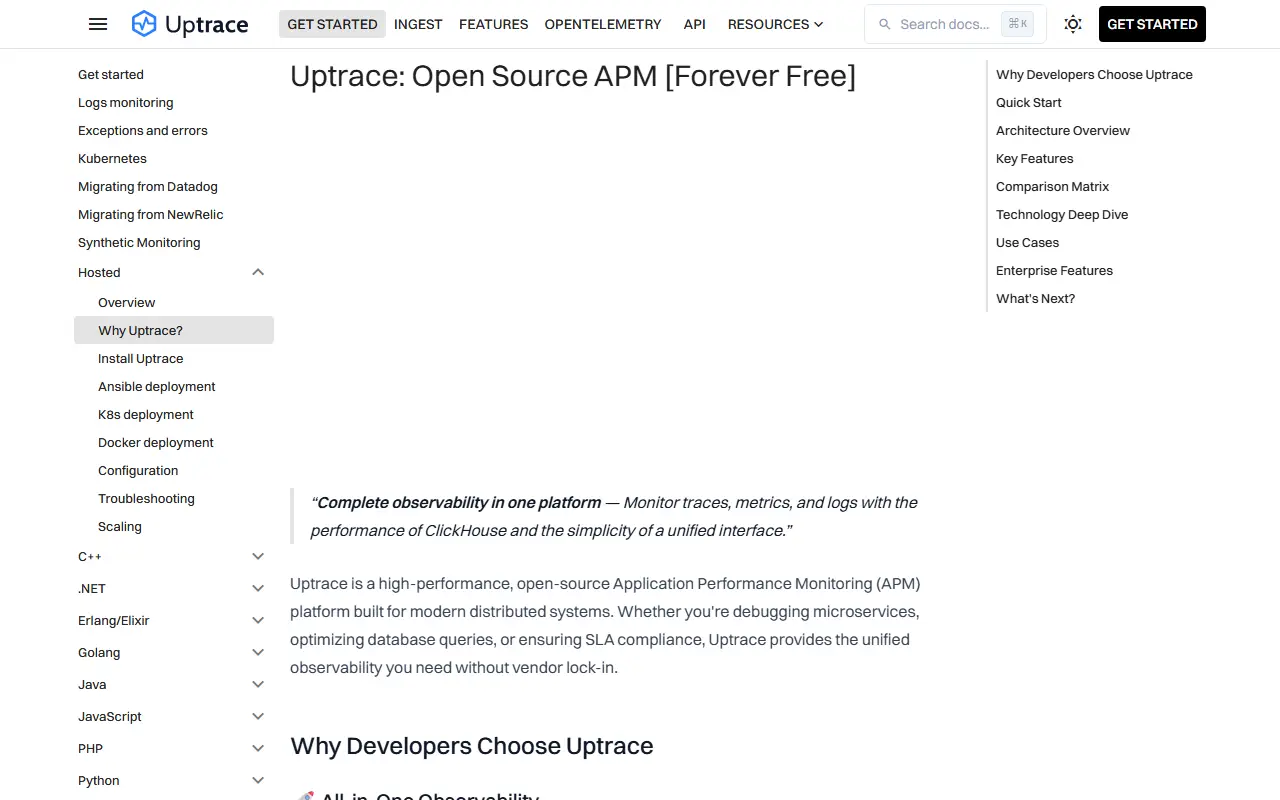
uptrace.devUptrace homepage screenshot

Uptrace is an open-source application performance monitoring platform. It collects distributed traces, metrics and logs through OpenTelemetry and presents them in a single interface, so teams can monitor applications and troubleshoot problems without switching between separate tracing, metrics and logging tools.

The interface includes a query builder, a service graph, faceted filters, chart annotations and many prebuilt dashboards that appear automatically as metrics arrive. Alerting rules send notifications through email, Slack, WebHook or AlertManager. Data can be ingested via OpenTelemetry, Prometheus, Vector, FluentBit and CloudWatch, Grafana can use Uptrace as a Tempo or Prometheus data source, and single sign-on works through OpenID Connect.

Uptrace is written in Go with a Vue front end, stores telemetry in ClickHouse and keeps metadata such as alerts in PostgreSQL. It is licensed under AGPL-3.0 and can be self-hosted with Docker, and a cloud demo needs no login. The project says it is meant to cut monitoring costs, which suits engineering teams comparing self-hosted APM options with commercial observability suites.

Key features

  • Unified view of traces, metrics, and logs
  • Prebuilt dashboards created automatically
  • Alert notifications via Email, Slack, and WebHook
  • SQL-like query language for spans
  • Grafana Tempo and Prometheus compatibility
  • OpenID Connect single sign-on

Pricing: Free and open source under the AGPL-3.0 licence.

Traceway

An OpenTelemetry-native observability platform combining logs, traces, metrics, exceptions, session replay and AI tracing, self-hosted or in the cloud.

GitHub stars
1.6k
Last commit
3 days ago
Latest release
cli/v2.0.3
Licence
MIT
Self-hosted
Yes
Hosted version
Available
tracewayapp.comTraceway homepage screenshot

Traceway is an observability platform built natively on OpenTelemetry. It brings logs, traces, metrics, exception tracking, session replay, AI tracing and on-call paging into one product, and you can start by pointing an OTLP exporter at it without a separate collector or a vendor-specific SDK for each language.

Logs are structured and linked to traces, so you can jump from a log line to its span. Traces show end-to-end waterfalls, endpoint views rank routes by latency percentiles and error rate, and exceptions are grouped into ranked issues with source map support. There is experimental profiling with flame graphs, session replay for web and Flutter apps, and LLM observability covering cost, tokens and latency.

The project is written in Go, licensed under MIT and says that every feature ships in the open-source build with no open-core split. You can self-host it for free, using a setup the README says takes about 90 seconds, or run it on Traceway Cloud if you prefer not to manage infrastructure. It suits engineering teams looking for one tool to find and diagnose production problems.

Key features

  • Structured logs linked to traces
  • End-to-end distributed tracing waterfalls
  • Grouped exception tracking with source maps
  • Session replay for web and Flutter
  • LLM cost and latency observability
  • On-call paging and alerting

Pricing: Free to self-host under the MIT licence with all features included; a hosted Traceway Cloud option is also available.

Honeycomb alternatives: questions

What is the best open-source alternative to Honeycomb?
SigNoz is the top-ranked open-source alternative to Honeycomb on Enlisted: An open-source observability platform built on OpenTelemetry that unifies APM, logs, metrics, traces, alerts and dashboards in one tool, self-hosted or in the cloud. Other strong options are Jaeger, OpenObserve, HyperDX and Highlight.io.
Are these Honeycomb alternatives free?
All 8 are open source, so the code is free to use under its licence, and all of them can be self-hosted on your own server or computer. 5 also offer a paid or managed cloud version if you'd rather not host it yourself.
How is this list of Honeycomb alternatives ranked?
By a score built from GitHub stars, star growth over the last 30 days and how recently the code changed. 7 of these projects shipped code in the last 30 days. Data is refreshed daily, and nobody can pay to move up.

People also look for alternatives to…

View all