
 Groundcover
 Chronosphere
 Splunk Observability Cloud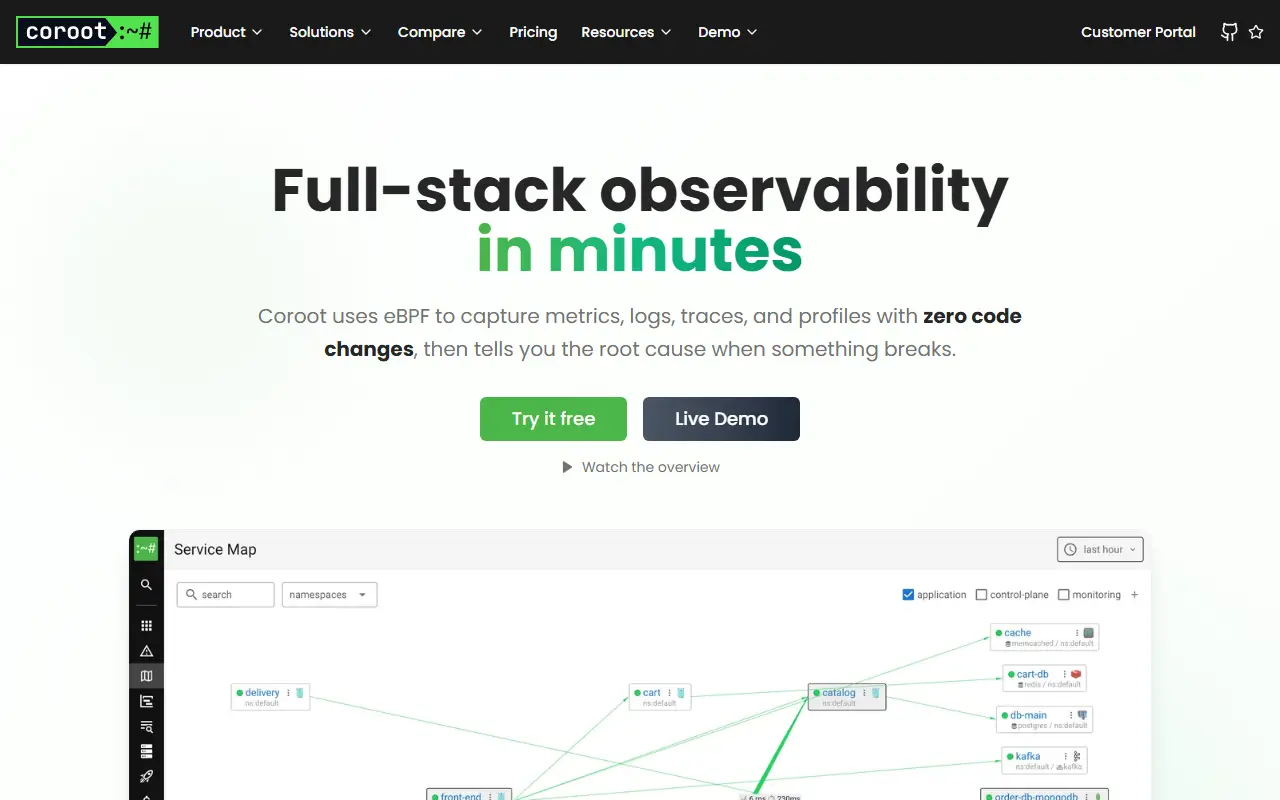
About Coroot
Coroot is an open-source observability and application performance monitoring tool. Its pitch is that collecting metrics, logs and traces is not enough on its own, so it turns the data into actionable insights, including AI-powered root cause analysis, predefined inspections and a service map.
It gathers metrics, logs, traces and continuous profiles automatically with eBPF, so legacy and third-party services can be observed without code changes, and it is also vendor-neutral through OpenTelemetry instrumentation. Features include a service map, application health summaries, SLO tracking and alerting, distributed tracing, log pattern clustering with logs-to-traces correlation using ClickHouse, and one-click profiling that drills down to the line of code. Predefined inspections audit each application without configuration.
Coroot is written in Go and licensed under Apache-2.0, with a live demo, documentation and a separate Coroot Enterprise edition. Topics include database monitoring, microservices and Prometheus. It suits SRE and platform teams that want observability for Kubernetes and Linux workloads without manually instrumenting every service.
Key features
- eBPF-based zero-instrumentation data collection
- Service map of the whole system
- SLO tracking and alerting
- Distributed tracing with OpenTelemetry
- Continuous profiling to the code line
- Log pattern clustering
- AI-powered root cause analysis
Good fit for
- →Observability for Kubernetes microservices
- →Finding the root cause of latency spikes
- →Monitoring legacy services without code changes
- Built with
- Go
- Tags
- observability
- apm
- ebpf
- monitoring
- opentelemetry
- slo
- profiling
- tracing
- golang
Coroot: questions and answers
- What is Coroot used for?
- Coroot is an open-source observability and APM tool that uses eBPF to collect metrics, logs, traces and profiles automatically, with SLO alerting and AI-assisted root cause analysis. It is a good fit for observability for Kubernetes microservices, finding the root cause of latency spikes and monitoring legacy services without code changes.
- Is Coroot open source?
- Yes. Coroot is open source under the Apache-2.0 licence. Its source code is on GitHub at coroot/coroot and is written mainly in Go.
- Is Coroot free?
- Yes. Coroot is open source, so the software itself is free to use.
- Can I self-host Coroot?
- Yes. Coroot can be self-hosted on your own server or infrastructure.
- What is Coroot an alternative to?
- Coroot is an open-source alternative to Datadog, Dynatrace, New Relic and AppDynamics. Other open-source alternatives to Datadog include SigNoz, Uptrace and HyperDX.
- Is Coroot actively maintained?
- Yes. The most recent commit to Coroot was on 30 September 2026, and the latest release is v1.27.0, published on 29 September 2026. The project has 7.9k stars on GitHub.
Open-source alternatives to Coroot
See all
SigNoz
Monitoring & Observability
SigNoz Cloud is a one-stop observability tool built on top of OpenTelemetry. Get APM, logs
OSSvs Datadog★ 32k
Uptrace
Monitoring & Observability
Open source APM: OpenTelemetry traces, metrics, and logs
AGPL-3.0vs Datadog★ 4.3k
HyperDX
Monitoring & Observability
Resolve production issues, fast. An open source observability platform unifying session re
MITvs Datadog★ 9.9k
OpenObserve
Monitoring & Observability
High-performance, unified observability for the AI era. 140x lower storage cost.
AGPL-3.0vs Datadog★ 22k
Jaeger
Monitoring & Observability
CNCF Jaeger, a Distributed Tracing Platform
Apache-2.0vs Datadog★ 23k
Pinpoint
Monitoring & Observability
APM, (Application Performance Management) tool for large-scale distributed systems.
Apache-2.0vs Dynatrace★ 14k
SaaS alternatives to Coroot
See all
Datadog
Monitoring & Observability
Datadog is a cloud monitoring and observability platform that brings metrics, logs and traces from applications, tools and services into one place.
SaaS
Dynatrace
Monitoring & Observability
Full-stack observability with automatic instrumentation and AI-based root-cause analysis
SaaS
New Relic
Monitoring & Observability
Observability platform for application performance, infrastructure and logs
SaaS
AppDynamics
Monitoring & Observability
Cisco application performance monitoring that maps technical metrics to business impact
SaaS
Honeycomb
Monitoring & Observability
Observability service for querying high-cardinality traces and events
SaaS
IBM Instana
Monitoring & Observability
Automated application performance monitoring for microservices and containers
SaaS