
 Sumo Logic
 Logz.io
 Papertrail
 Loggly
 Rollbar
 Bugsnag
 Airbrake
 Raygun
 Honeybadger
 IBM Instana
 Coralogix
 Axiom
Axiom AppSignal
 Google Cloud Observability
 Zipy
Zipy FullSession
 Noibu
Noibu LiveSession
 Chronosphere
 Observe
 Scout Monitoring
 Splunk Observability Cloud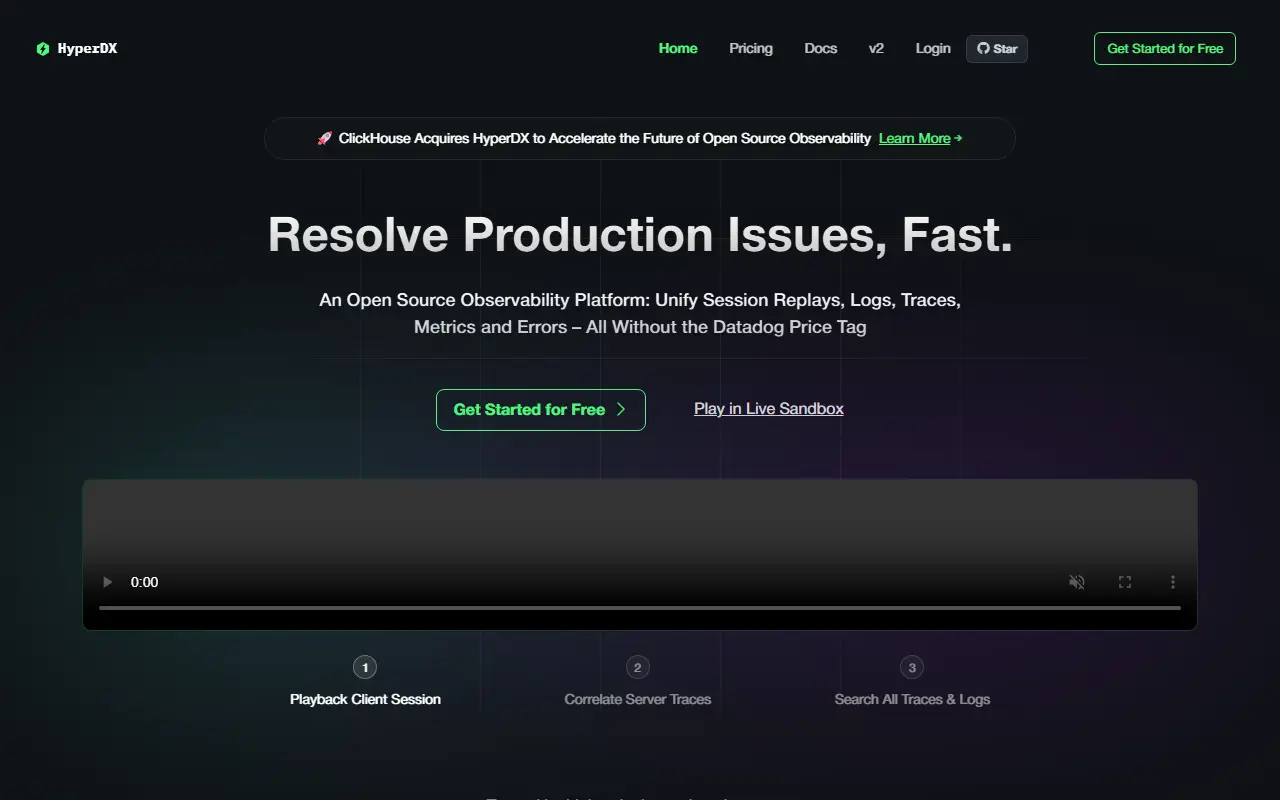
About HyperDX
HyperDX is an open-source observability platform for working out why production is broken. It brings logs, metrics, traces, errors and session replays into one place, and works as a search and visualization layer on top of ClickHouse and OpenTelemetry, which the authors compare to Kibana for ClickHouse. It is a core component of ClickStack.
It is schema agnostic and can sit on top of an existing ClickHouse schema. Searching uses full-text and property syntax such as level:err, with SQL as an option, events can be compared with event deltas, high-cardinality events can be charted on dashboards, and alerts can be set up in a few clicks. Live tail shows the newest logs and traces, JSON strings can be queried natively, OpenTelemetry works out of the box, and APM views cover HTTP requests down to database queries.
One deployment option is ClickStack, a bundle of ClickHouse, HyperDX, an OpenTelemetry Collector and MongoDB, and HyperDX can instead be pointed at your own ClickHouse instance. It can also be used with ClickHouse Cloud. The project is MIT licensed and written in TypeScript.
Key features
- Unified logs, metrics, traces and session replays
- Schema-agnostic search on ClickHouse
- Full-text and property search syntax
- Alerts and event delta analysis
- Live tail for logs and traces
- OpenTelemetry support out of the box
- Dashboards for high-cardinality events
Good fit for
- →Debugging production incidents
- →Centralizing logs and traces on ClickHouse
- →Frontend and backend application monitoring
- Tags
- observability
- logs
- tracing
- session-replay
- clickhouse
- opentelemetry
- apm
- self-hosted
- monitoring
HyperDX: questions and answers
- What is HyperDX used for?
- HyperDX is an open-source observability platform that unifies logs, traces, metrics and session replays on top of ClickHouse and OpenTelemetry, a Kibana-style experience for ClickHouse. It is a good fit for debugging production incidents, centralizing logs and traces on ClickHouse, and frontend and backend application monitoring.
- Is HyperDX open source?
- Yes. HyperDX is open source under the MIT licence. Its source code is on GitHub at hyperdxio/hyperdx and is written mainly in TypeScript.
- Is HyperDX free?
- Yes. HyperDX is open source, so the software itself is free to use. A managed cloud version is also available, with paid plans from $20 per month.
- Can I self-host HyperDX?
- Yes. HyperDX can be self-hosted on your own server or infrastructure.
- What is HyperDX an alternative to?
- HyperDX is an open-source alternative to Datadog, Sentry, LogRocket and New Relic. Other open-source alternatives to Datadog include Traceway, SigNoz and Highlight.io.
- Is HyperDX actively maintained?
- Yes. The most recent commit to HyperDX was on 2 October 2026. The project has 9.9k stars on GitHub.
Open-source alternatives to HyperDX
See all
Traceway
Monitoring & Observability
The only tool you need to know what is happening and how to fix it.
MITvs Datadog★ 1.6k
SigNoz
Monitoring & Observability
SigNoz Cloud is a one-stop observability tool built on top of OpenTelemetry. Get APM, logs
OSSvs Datadog★ 32k
Highlight.io
Monitoring & Observability
Highlight gives your team full transparency into the errors, interactions, and performance
OSSvs Sentry★ 9.4k
OpenObserve
Monitoring & Observability
High-performance, unified observability for the AI era. 140x lower storage cost.
AGPL-3.0vs Datadog★ 22k
Uptrace
Monitoring & Observability
Open source APM: OpenTelemetry traces, metrics, and logs
AGPL-3.0vs Datadog★ 4.3k
Sentry
Monitoring & Observability
Developer-first error tracking and performance monitoring
OSSvs Rollbar★ 45k
SaaS alternatives to HyperDX
See all
Datadog
Monitoring & Observability
Datadog is a cloud monitoring and observability platform that brings metrics, logs and traces from applications, tools and services into one place.
SaaS
Sentry
Monitoring & Observability
Sentry is an error tracking and application performance monitoring platform that helps developers find, trace and fix problems in web, mobile and backend code.
SaaS
LogRocket
Session Replay
Session replay combined with error tracking and front-end performance monitoring
SaaS
New Relic
Monitoring & Observability
Observability platform for application performance, infrastructure and logs
SaaS
AppDynamics
Monitoring & Observability
Cisco application performance monitoring that maps technical metrics to business impact
SaaS
Honeycomb
Monitoring & Observability
Observability service for querying high-cardinality traces and events
SaaS