Grafana
An open-source platform for visualizing metrics, logs and traces from many data sources, with dashboards, alerting and ad-hoc exploration.
- GitHub stars
- 77k
- Last commit
- today
- Latest release
- v13.2.3
- Licence
- AGPL-3.0
- Self-hosted
- Yes
- Hosted version
- Available
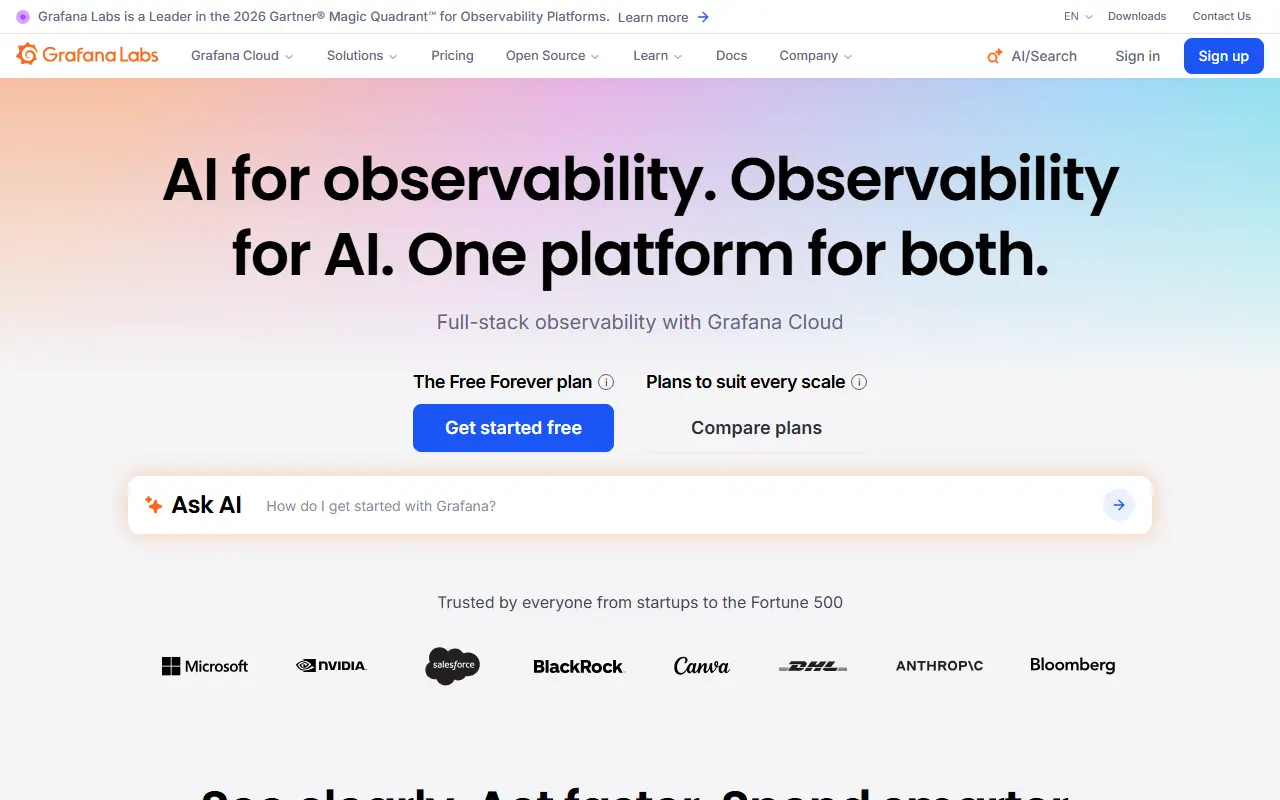
Grafana is a visualization and observability platform that lets you query, chart and alert on data wherever it is stored. It does not hold your data itself; it connects to sources such as Prometheus, Loki, Elasticsearch, InfluxDB, MySQL and PostgreSQL and brings their results together in shared dashboards.
Dashboards can be made reusable with template variables that appear as dropdowns, and a single graph may mix queries against different data sources. Explore views support ad-hoc queries, side-by-side comparison of time ranges and a jump from metrics to logs while keeping label filters. Alert rules are defined visually, and notifications go to systems like Slack, PagerDuty, VictorOps and OpsGenie. Panel plugins add further visualization types.
Grafana is AGPL-3.0 licensed, written in Go and TypeScript, and can be installed on your own servers; Grafana Labs also runs a hosted offering. It is common in DevOps and SRE teams as the dashboard layer on top of Prometheus-style monitoring, and a public demo site lets you try it first.
Key features
- Dashboards with template variables
- Mixed data sources in a single graph
- Visual alert rules with Slack and PagerDuty
- Explore view for ad-hoc metric and log queries
- Panel plugins for extra visualizations
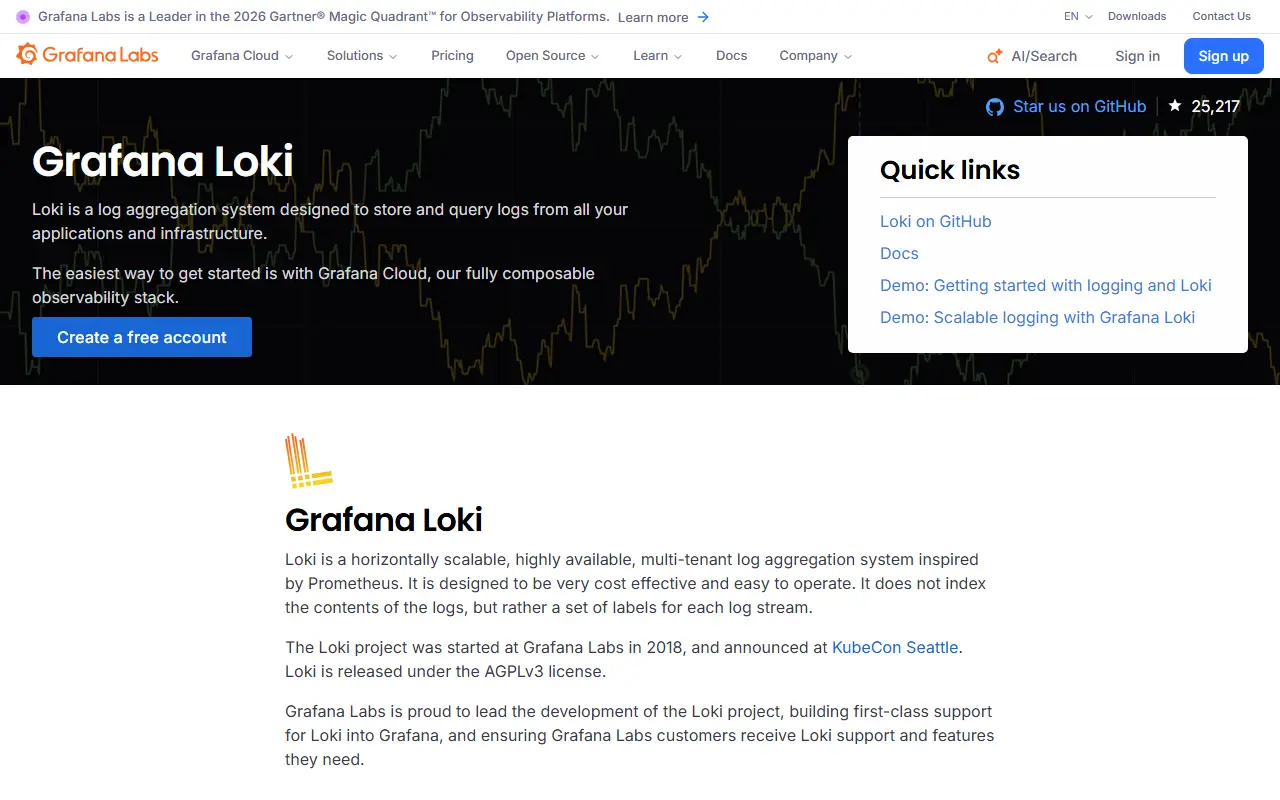
- Connects to Prometheus, Loki and SQL databases
Pricing: Grafana Cloud has an always-free tier with usage limits. Pro starts at $19 per month plus usage; Enterprise starts at a $25,000 annual spend commit and is sold through sales.