 TrackMedia
 TrackRev

 Coralogix
 Axiom
 Amazon CloudWatch
 Azure Monitor
 Google Cloud Observability
 Chronosphere
 Observe
 Mezmo
 Sematext
 SolarWinds Observability
 Azure Data Explorer
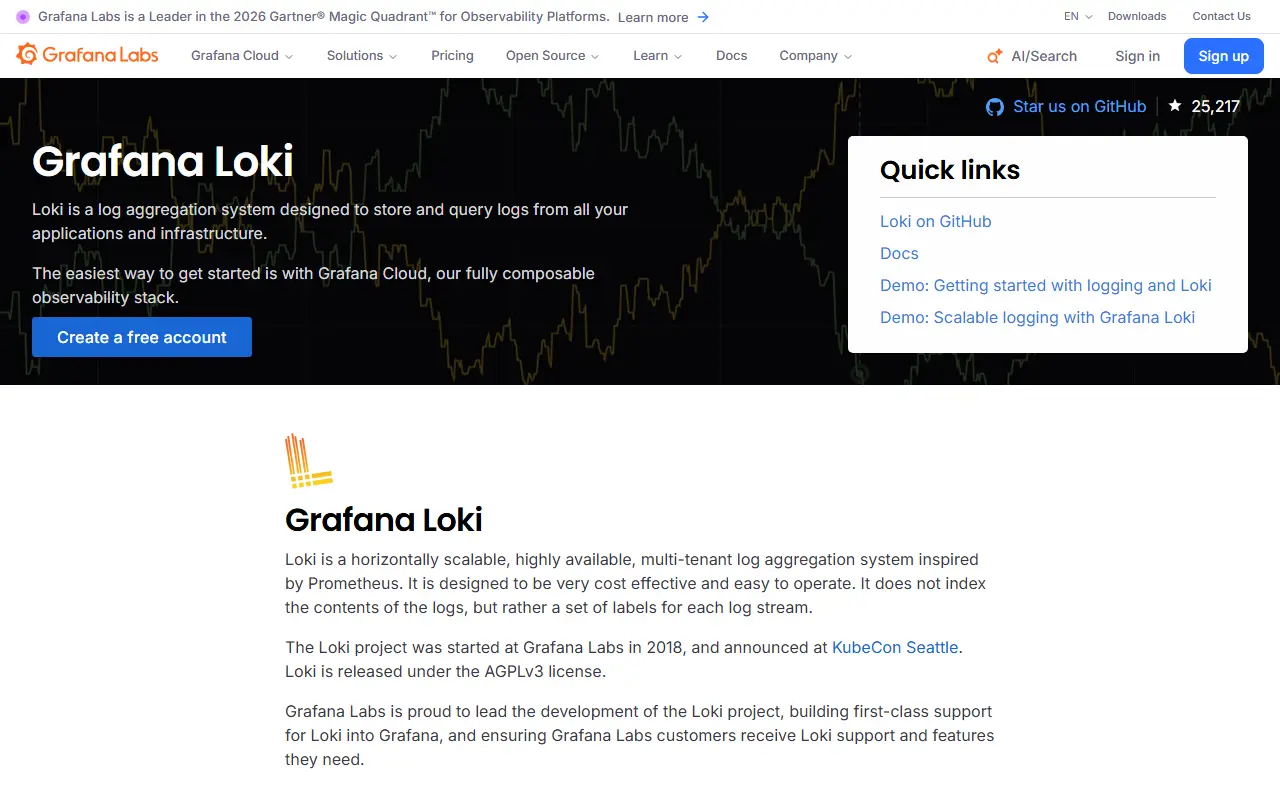
About Grafana Loki
Loki is a log aggregation system from Grafana, described as Prometheus for logs. It is horizontally scalable, highly available and multi-tenant. Instead of indexing the contents of log lines, it indexes a set of labels for each log stream and stores the compressed log text, which the project says makes it simpler to operate and cheaper to run. It is written in Go and released under the AGPL-3.0 license.
Because Loki reuses the labels familiar from Prometheus, you can move between metrics and logs using the same label sets, and it has native support in Grafana. It works especially well for Kubernetes pod logs, since metadata such as pod labels is scraped and indexed automatically. A typical stack has three parts: Alloy as the collection agent, Loki for storage and queries, and Grafana for exploration. Alloy replaces Promtail, which is considered feature complete. Unlike Prometheus, Loki receives logs by push.
Key features
- Label-based indexing instead of full-text indexing
- Horizontally scalable, multi-tenant architecture
- Native Grafana integration for querying logs
- Automatic Kubernetes pod label indexing
- Grafana Alloy agent for log collection
- Single-binary deployment option
Good fit for
- Centralized logs for Kubernetes clusters
- Correlating metrics and logs in Grafana
Grafana Loki: questions and answers
- What is Grafana Loki used for?
- Grafana Loki is a horizontally scalable log aggregation system that indexes labels instead of log contents, inspired by Prometheus. It is a good fit for centralized logs for Kubernetes clusters, and correlating metrics and logs in Grafana.
- Is Grafana Loki open source?
- Yes. Grafana Loki is open source under the AGPL-3.0 licence. Its source code is on GitHub at grafana/loki and is written mainly in Go.
- Is Grafana Loki free?
- Yes. Grafana Loki is open source, so the software itself is free to use. A managed cloud version is also available.
- Can I self-host Grafana Loki?
- Yes. Grafana Loki can be self-hosted on your own server or infrastructure.
- What is Grafana Loki an alternative to?
- Grafana Loki is an open-source alternative to Datadog, Splunk, Sumo Logic and Papertrail. Other open-source alternatives to Datadog include Kibana, SigNoz and OpenObserve.
- Is Grafana Loki actively maintained?
- Yes. The most recent commit to Grafana Loki was on 12 November 2026, and the latest release is v3.7.9, published on 20 October 2026. The project has 29k stars on GitHub, with 156 added in the last 30 days.
Open-source alternatives to Grafana Loki
See all
Kibana
Monitoring & Observability
Your window into all of your data
OSSvs Splunk★ 21k
SigNoz
Monitoring & Observability
SigNoz Cloud is a one-stop observability tool built on top of OpenTelemetry. Get APM, logs
OSSvs Datadog★ 33k
OpenObserve
Monitoring & Observability
High-performance, unified observability for the AI era. 140x lower storage cost.
AGPL-3.0vs Datadog★ 23k
HyperDX
Monitoring & Observability
Resolve production issues, fast. An open source observability platform unifying session re
MITvs Datadog★ 10k
VictoriaMetrics
Monitoring & Observability
VictoriaMetrics: fast, cost-effective monitoring solution and time series database
Apache-2.0vs Datadog★ 18k
Graylog
Monitoring & Observability
Free and open log management
OSSvs Splunk★ 8.2k
SaaS alternatives to Grafana Loki
See all
Datadog
Monitoring & Observability
Datadog is a cloud monitoring and observability platform that brings metrics, logs and traces from applications, tools and services into one place.
SaaS
Splunk
Monitoring & Observability
Splunk is a data platform for security and observability that collects, searches and analyzes machine data to detect threats and prevent downtime.
SaaS
Sumo Logic
Monitoring & Observability
Cloud log analytics and security monitoring platform
SaaS
Papertrail
Monitoring & Observability
Hosted log aggregation with live tail and search, from SolarWinds
SaaS
Logz.io
Monitoring & Observability
Managed observability stack for logs, metrics and traces built on open tooling
SaaS
Loggly
Monitoring & Observability
Cloud log management with search, dashboards and alerting
SaaS