7,363 open-source and SaaS tools, with GitHub stats refreshed every day.

10 alternatives ranked by real activity

Open-source Sematext alternatives

A curated, ranked list of the 10 best open-source alternatives to Sematext.

The best open-source alternative to Sematext is Netdata. If that doesn't suit you, other good options are Grafana, Prometheus, SigNoz and Grafana Loki.

Sematext alternatives are mainly monitoring & observability tools. 10 of them shipped code in the last 30 days, 10 can be self-hosted, and 2 use a permissive licence.

Last updated October 3, 2026 · ranked by GitHub stars, growth and recent commits

Netdata

An open-source infrastructure monitoring platform that collects per-second metrics with little configuration and adds machine-learning anomaly detection and alerting.

GitHub stars
81k
Last commit
today
Latest release
v2.12.0
Licence
GPL-3.0
Self-hosted
Yes
Hosted version
Available
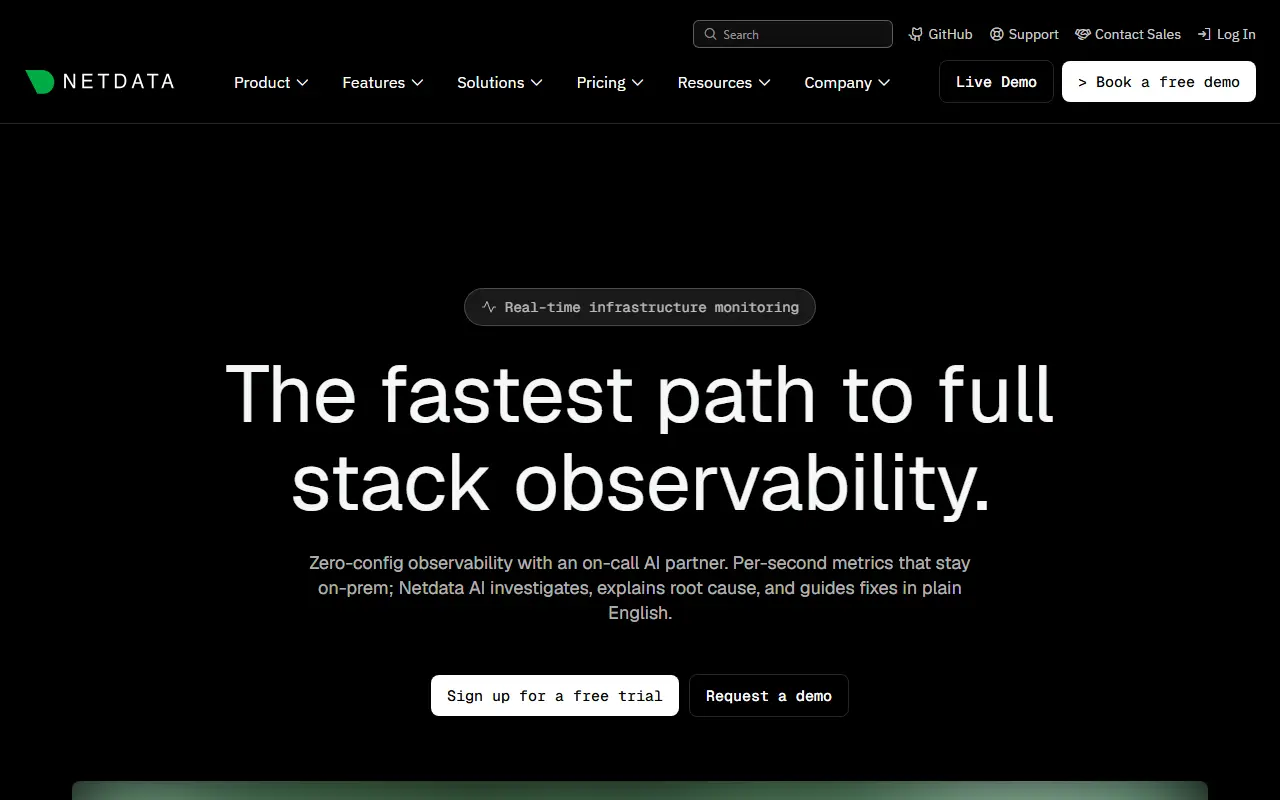
netdata.cloudNetdata homepage screenshot

Netdata is a real-time infrastructure monitoring platform. You install an agent on servers, containers or Kubernetes nodes and it starts collecting metrics every second, showing them on dashboards without lengthy setup. Its origin story is a frustration with monitoring tools that offered few metrics at low resolution and cost too much to run.

The project highlights zero-configuration deployment, machine-learning-based anomaly detection and automated analysis, and an efficient agent that uses few resources. Data stays distributed on the monitored machines instead of being shipped to one central store. Integrations cover databases such as MySQL, PostgreSQL and MongoDB, plus Docker and Kubernetes, and the topics list mentions export paths to Prometheus, Grafana and InfluxDB. Netdata also advertises AI-assisted troubleshooting and an MCP interface.

The agent is GPL-3.0 licensed and written largely in Go, and Netdata Cloud offers a hosted layer for viewing many nodes together. It suits operations teams and lean engineering groups that want deep visibility quickly rather than building a metrics stack from several separate tools.

Key features

  • Per-second metrics for servers and containers
  • Zero-configuration agent deployment
  • Machine-learning anomaly detection
  • Alerting on infrastructure issues
  • Database, Docker and Kubernetes monitoring
  • Distributed storage that keeps data local

Pricing: The agent is free and Community covers up to 5 nodes. Homelab costs $90 per year for unlimited nodes and Business $4.50 per node per month billed annually.

Grafana

An open-source platform for visualizing metrics, logs and traces from many data sources, with dashboards, alerting and ad-hoc exploration.

GitHub stars
77k
Last commit
today
Latest release
v13.2.3
Licence
AGPL-3.0
Self-hosted
Yes
Hosted version
Available
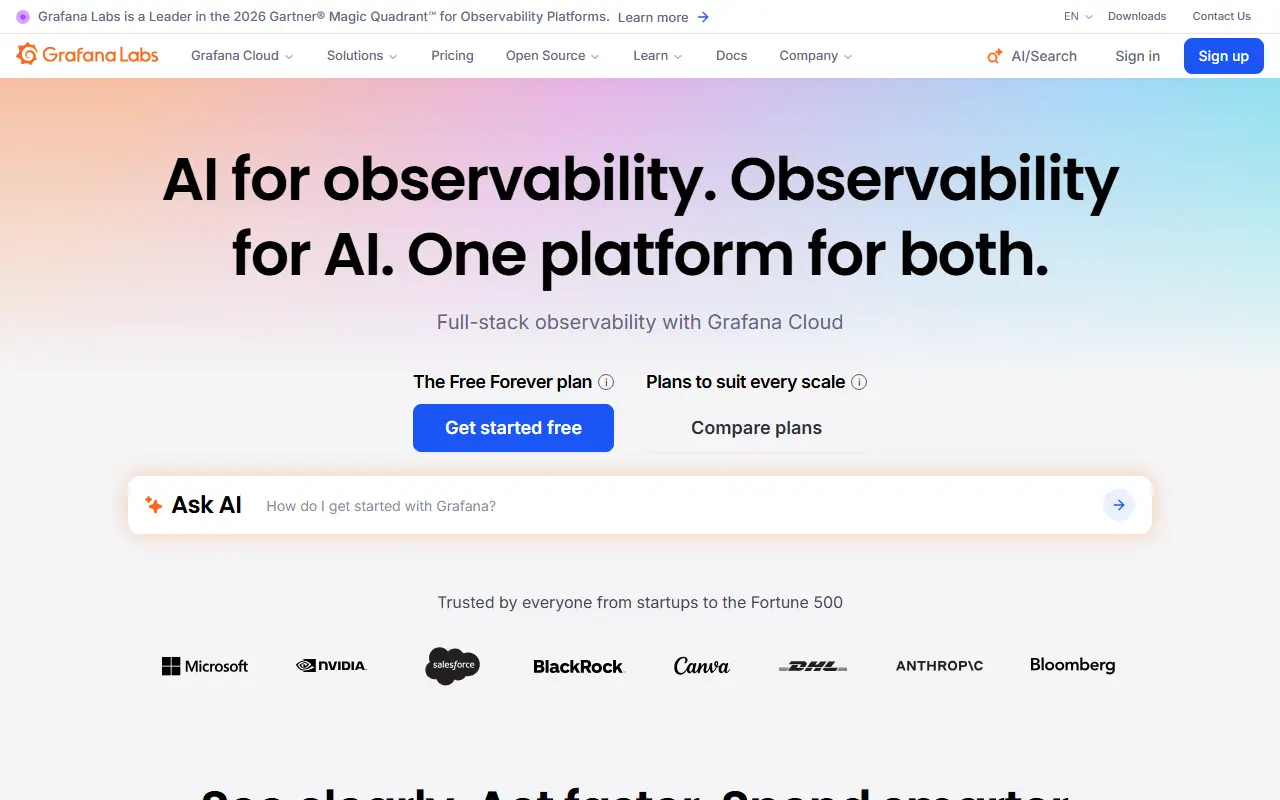
grafana.comGrafana homepage screenshot

Grafana is a visualization and observability platform that lets you query, chart and alert on data wherever it is stored. It does not hold your data itself; it connects to sources such as Prometheus, Loki, Elasticsearch, InfluxDB, MySQL and PostgreSQL and brings their results together in shared dashboards.

Dashboards can be made reusable with template variables that appear as dropdowns, and a single graph may mix queries against different data sources. Explore views support ad-hoc queries, side-by-side comparison of time ranges and a jump from metrics to logs while keeping label filters. Alert rules are defined visually, and notifications go to systems like Slack, PagerDuty, VictorOps and OpsGenie. Panel plugins add further visualization types.

Grafana is AGPL-3.0 licensed, written in Go and TypeScript, and can be installed on your own servers; Grafana Labs also runs a hosted offering. It is common in DevOps and SRE teams as the dashboard layer on top of Prometheus-style monitoring, and a public demo site lets you try it first.

Key features

  • Dashboards with template variables
  • Mixed data sources in a single graph
  • Visual alert rules with Slack and PagerDuty
  • Explore view for ad-hoc metric and log queries
  • Panel plugins for extra visualizations
  • Connects to Prometheus, Loki and SQL databases

Pricing: Grafana Cloud has an always-free tier with usage limits. Pro starts at $19 per month plus usage; Enterprise starts at a $25,000 annual spend commit and is sold through sales.

Prometheus

A CNCF metrics monitoring system and time series database that scrapes targets, evaluates alert rules and offers the PromQL query language.

GitHub stars
66k
Last commit
today
Latest release
v3.15.0
Licence
Apache-2.0
Self-hosted
Yes
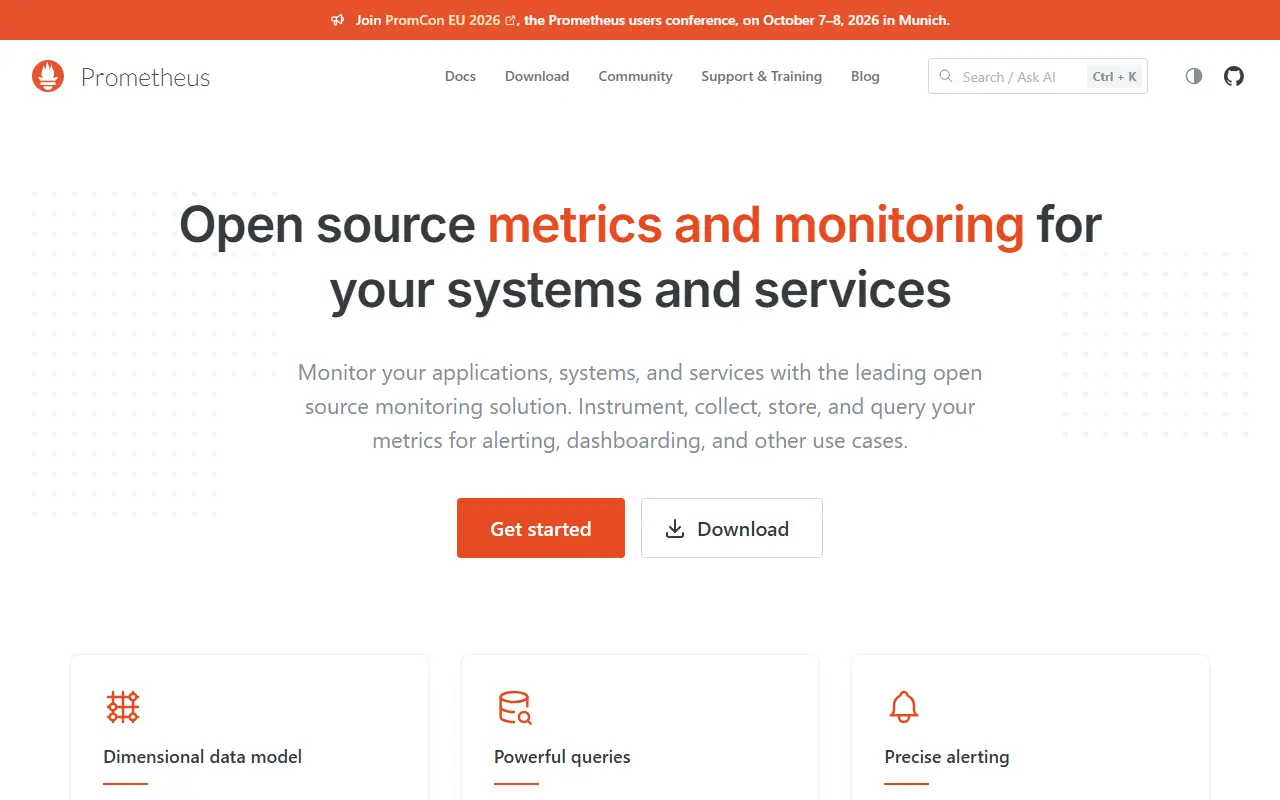
prometheus.ioPrometheus homepage screenshot

Prometheus is a systems and service monitoring tool and time series database, and a project of the Cloud Native Computing Foundation. It collects metrics from configured targets at set intervals, evaluates rule expressions, shows the results and can fire alerts when conditions are met.

Its data model is multi-dimensional: a time series is identified by a metric name plus key and value labels, and PromQL is the query language built to exploit that structure. Collection uses an HTTP pull model, with a gateway available for pushing metrics from short-lived batch jobs, and targets are found through service discovery or static configuration. Single server nodes are autonomous with no dependence on distributed storage, and hierarchical and horizontal federation is supported.

Prometheus is written in Go under the Apache-2.0 license and ships as precompiled binaries and Docker images on Quay.io and Docker Hub, or can be built from source. It has no hosted service of its own and is typically run next to exporters and a dashboarding tool such as Grafana, which suits cloud-native and Kubernetes environments.

Key features

  • Multi-dimensional time series data model
  • PromQL query language
  • HTTP pull-based metric collection
  • Service discovery for targets
  • Alerting rules evaluated on collected metrics
  • Federation across Prometheus servers
  • Push gateway for batch jobs

Pricing: Free and open source under the Apache-2.0 license.

SigNoz

An open-source observability platform built on OpenTelemetry that unifies APM, logs, metrics, traces, alerts and dashboards in one tool, self-hosted or in the cloud.

GitHub stars
32k
Last commit
today
Latest release
v0.144.0
Self-hosted
Yes
Hosted version
Available
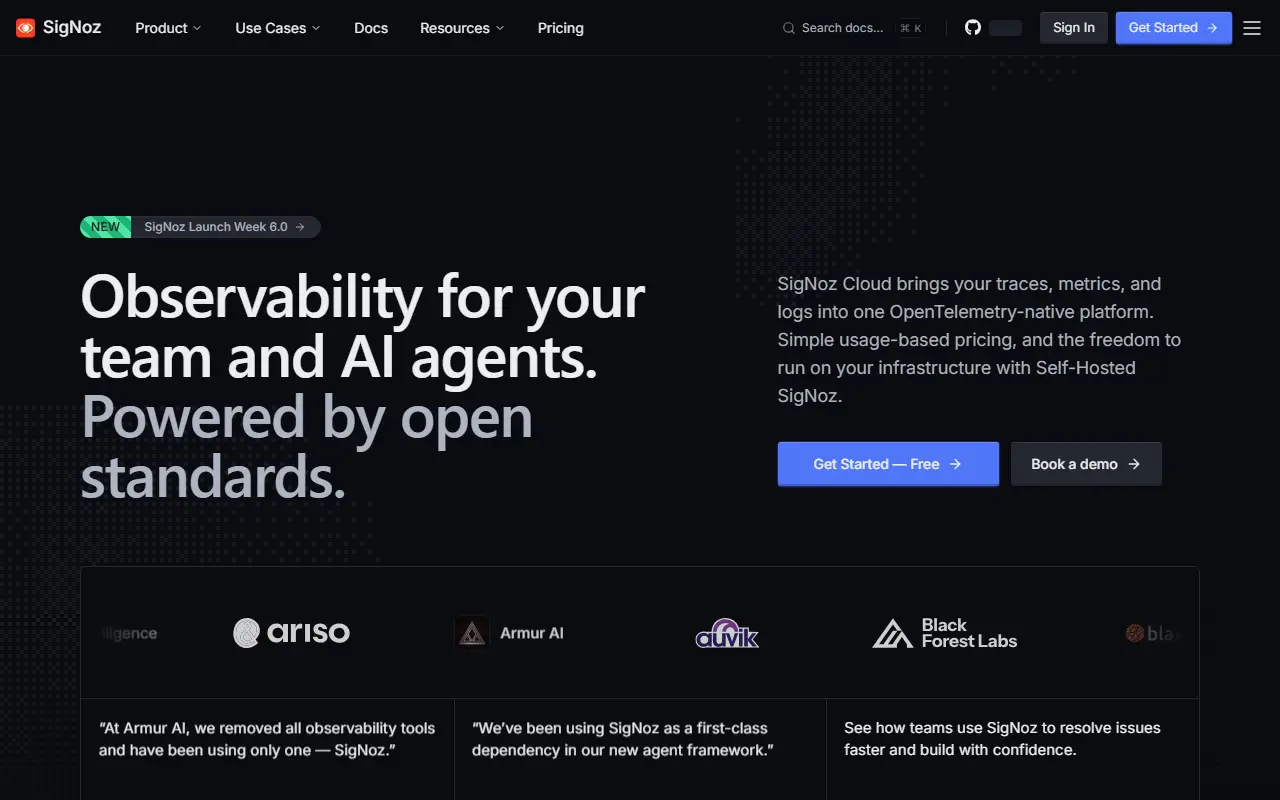
signoz.ioSigNoz homepage screenshot

SigNoz is an observability platform, open source and built on OpenTelemetry. It aims to replace a fragmented monitoring stack with a single place for logs, metrics, traces, alerts, exceptions and dashboards, and it presents itself as useful for both engineering teams and their AI agents.

The APM view follows how each service performs, covering latency, error rate, throughput, Apdex, the busiest endpoints, and calls to databases and external services. Log management supports ingesting, searching and correlating logs with traces and metrics through a visual query builder. Dashboards can be built with a query builder, PromQL or ClickHouse SQL, infrastructure monitoring covers Kubernetes clusters, pods, nodes and host resources, and LLM and AI observability traces prompts, tool calls, tokens, latency and cost.

You can choose how to run it. SigNoz Cloud is fully managed, with a 30-day free trial and usage-based pricing that starts at $49. Enterprise options cover cloud, bring-your-own-cloud and self-hosted deployments with extra support and controls. The free Community edition runs in your own infrastructure via Docker, Kubernetes or Linux. The repository license is listed as 'Other' on GitHub.

Key features

  • OpenTelemetry-native logs, metrics and traces
  • APM with latency, error rate and Apdex
  • Log management with a visual query builder
  • Dashboards via query builder, PromQL or SQL
  • Kubernetes infrastructure monitoring
  • LLM and AI application observability
  • Alerts and exception tracking

Pricing: Self-hosted Community is free. SigNoz Cloud Teams starts at $49 per month including $49 of usage, then usage-based per GB; Enterprise is custom and starts at $4000 per month.

Grafana Loki

Grafana Loki is a horizontally scalable log aggregation system that indexes labels instead of log contents, inspired by Prometheus.

GitHub stars
29k
Last commit
today
Latest release
v3.7.8
Licence
AGPL-3.0
Self-hosted
Yes
Hosted version
Available
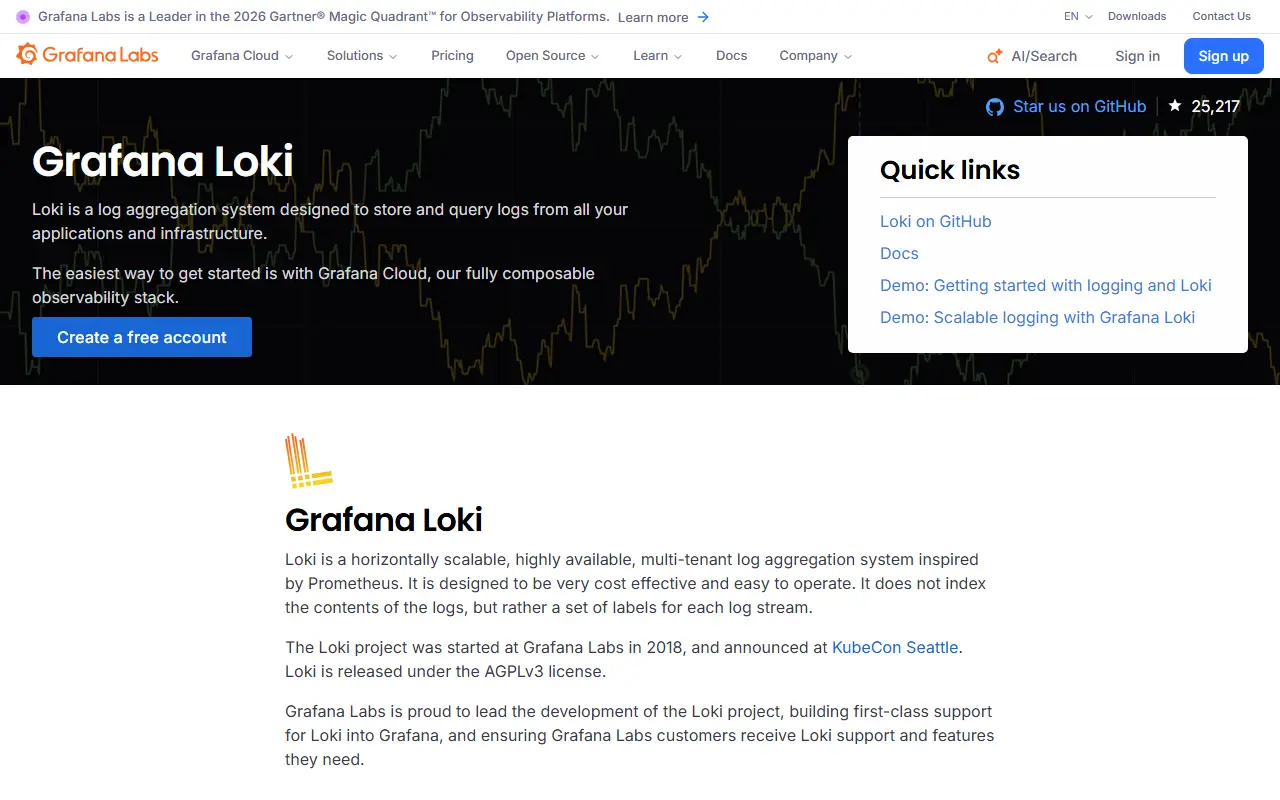
grafana.comGrafana Loki homepage screenshot

Loki is a log aggregation system from Grafana, described as Prometheus for logs. It is horizontally scalable, highly available and multi-tenant. Instead of indexing the contents of log lines, it indexes a set of labels for each log stream and stores the compressed log text, which the project says makes it simpler to operate and cheaper to run. It is written in Go and released under the AGPL-3.0 license.

Because Loki reuses the labels familiar from Prometheus, you can move between metrics and logs using the same label sets, and it has native support in Grafana. It works especially well for Kubernetes pod logs, since metadata such as pod labels is scraped and indexed automatically. A typical stack has three parts: Alloy as the collection agent, Loki for storage and queries, and Grafana for exploration. Alloy replaces Promtail, which is considered feature complete. Unlike Prometheus, Loki receives logs by push.

Key features

  • Label-based indexing instead of full-text indexing
  • Horizontally scalable, multi-tenant architecture
  • Native Grafana integration for querying logs
  • Automatic Kubernetes pod label indexing
  • Grafana Alloy agent for log collection
  • Single-binary deployment option

Pricing: Free and open source under the AGPL-3.0 license.

OpenObserve

A cloud-native observability platform covering logs, metrics, traces, RUM and LLM monitoring, with Parquet columnar storage on S3 and a pitch against Datadog and Splunk.

GitHub stars
22k
Last commit
today
Latest release
v1.1.0-rc1
Licence
AGPL-3.0
Self-hosted
Yes
Hosted version
Available
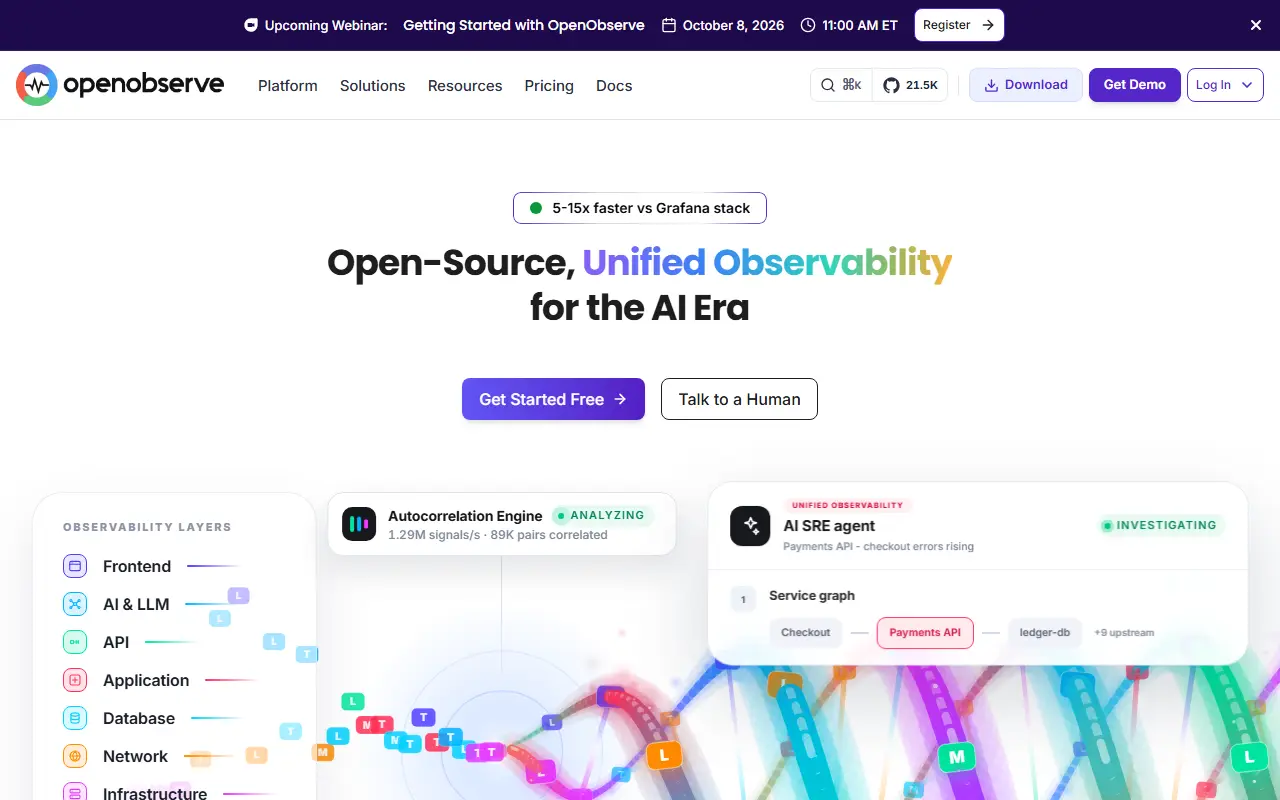
openobserve.aiOpenObserve homepage screenshot

OpenObserve, often shortened to O2, is open-source observability software spanning logs, metrics, traces and analytics, real user monitoring on web, Android and iOS, session replay, pipelines, SLOs and AI and LLM observability. It is pitched as a lower-cost option next to Datadog, Splunk and Elasticsearch for teams that want complete observability without the complexity or price.

Its architecture uses Parquet columnar storage and an S3-native design, which the project says can cut storage costs by up to 140 times compared with Elasticsearch, with petabyte-scale capacity. Topics reference OpenTelemetry, Prometheus, Jaeger and Kibana, showing the standards and tools it interoperates with. The README has sections on architecture, comparisons, production readiness, security and compliance, and an enterprise edition.

OpenObserve is AGPL-3.0 licensed, with a hosted cloud option and a self-hosted deployment, and documentation and a Slack community are provided. It suits engineering teams looking to consolidate logging, metrics and tracing in one tool while keeping storage costs under control.

Key features

  • Logs, metrics and traces in one platform
  • Real user monitoring and session replay
  • LLM and AI observability
  • Parquet columnar storage on S3
  • OpenTelemetry and Prometheus compatibility
  • Pipelines and SLO tracking

Pricing: Self-hosting is free. Cloud is pay-as-you-go at $0.50 per GB ingested plus $0.01 per GB queried, with unlimited users and a 14-day trial; Enterprise is custom.

Kibana

Kibana is the web interface for querying, visualizing and managing data stored in Elasticsearch, used for dashboards, observability and analytics.

GitHub stars
21k
Last commit
today
Latest release
v9.5.4
Self-hosted
Yes
Hosted version
Available
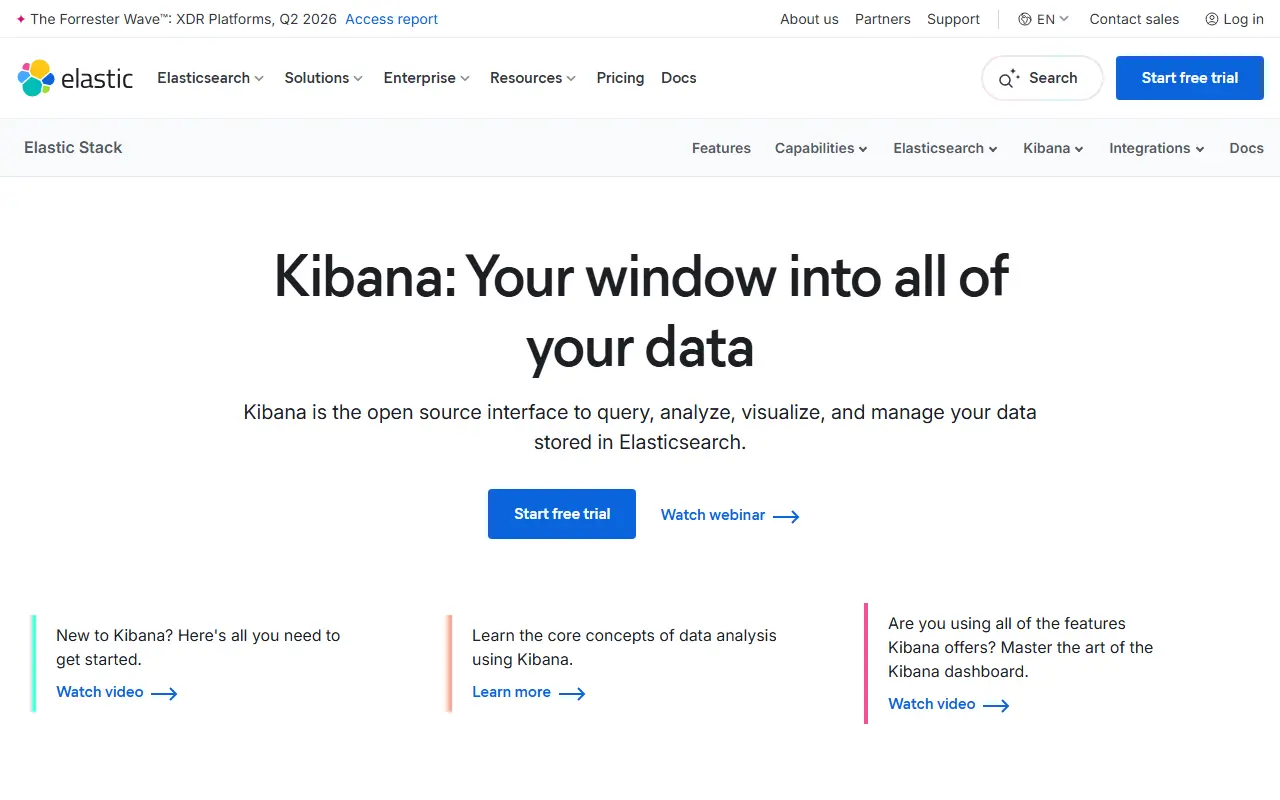
elastic.coKibana homepage screenshot

Kibana is the user interface that sits on top of Elasticsearch. It lets people query, analyze, visualize and manage the data stored there, turning indexes into charts, metrics views and dashboards. It is part of the Elastic Stack and is commonly used for log analysis, observability and general analytics work.

Teams build visualizations and assemble them into shared dashboards, explore documents with search, and use the interface to manage parts of an Elasticsearch deployment. The project advises running Kibana and Elasticsearch at the same version, with major versions required to match, because mismatches can cause problems and support may ask for an upgrade first.

The code is written in TypeScript. The repository lists its license as 'Other' rather than a standard SPDX identifier, so the license files should be read for the exact terms. Kibana can be downloaded and run on your own infrastructure, and Elastic also offers a hosted version through its Cloud service.

Key features

  • Query and explore Elasticsearch data
  • Visualizations and metrics charts
  • Shared dashboards for monitoring
  • Observability views for logs and metrics
  • Management tools for Elasticsearch data
  • Hosted option through Elastic Cloud

VictoriaMetrics

A scalable time series database and monitoring solution that is compatible with the Prometheus ecosystem, available as single-node and cluster versions.

GitHub stars
18k
Last commit
today
Latest release
v1.153.0
Licence
Apache-2.0
Self-hosted
Yes
Hosted version
Available
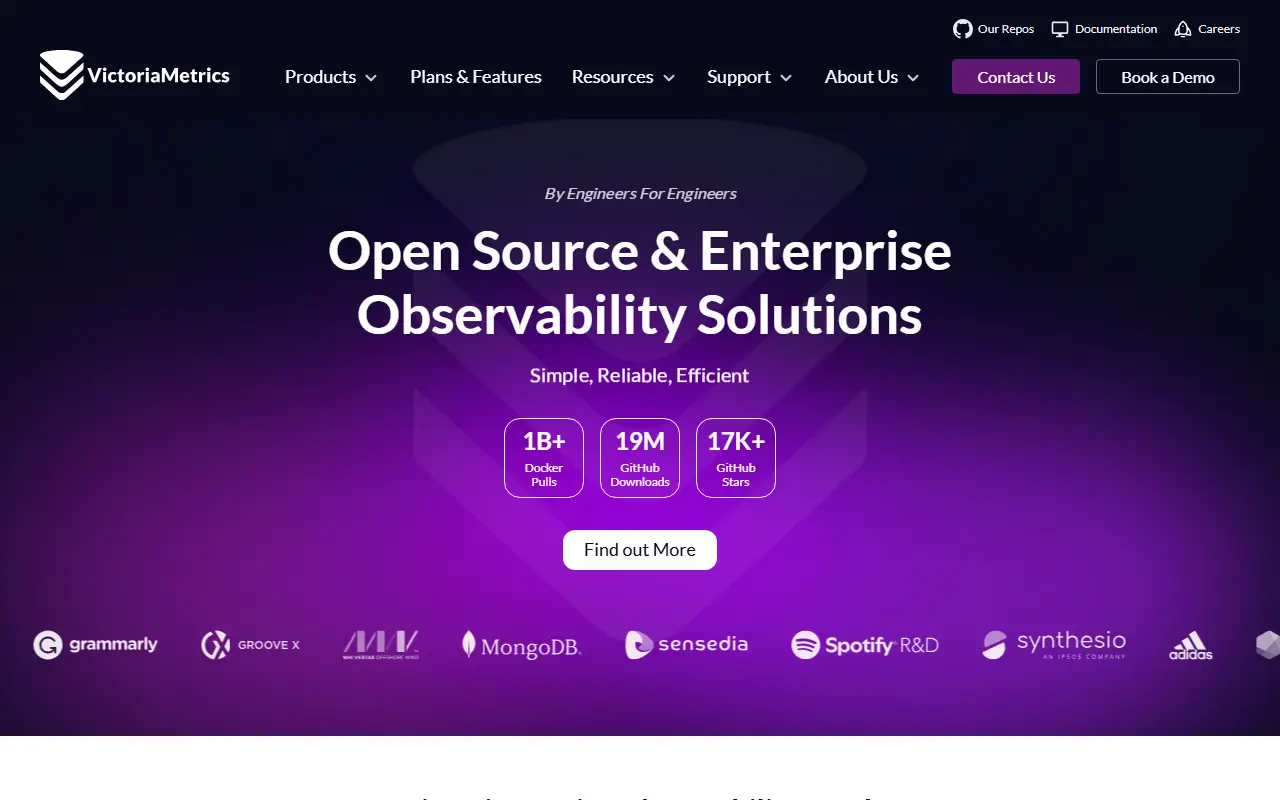
victoriametrics.comVictoriaMetrics homepage screenshot

VictoriaMetrics is a monitoring solution and time series database built for performance, cost efficiency and scale. It stores metrics, works with the Prometheus ecosystem and query language, and its topics also list support for InfluxDB, Graphite and OpenTSDB data formats, along with Grafana for dashboards, which makes it a common drop-in backend for existing monitoring setups.

It is offered as a single-node version and a cluster version, both under the Apache License 2.0, with downloadable binaries, container images published to Docker Hub and Quay, and the source code. The project publishes case studies from well-known companies, a quick start and key concepts guide, community channels on Slack, X and YouTube, and a fast-moving changelog. Enterprise support and enterprise releases with long-term support are available, and they can be evaluated with a free trial license. The maintainers also mention security certifications for their development practices.

Written in Go, VictoriaMetrics suits platform and SRE teams that want to store large volumes of metrics efficiently, replacing or extending Prometheus long-term storage. It can be deployed on your own infrastructure, including Kubernetes, and the company offers a managed cloud service as well.

Key features

  • Time series database for metrics
  • Prometheus and PromQL compatibility
  • Single-node and cluster versions
  • Docker images and binary releases
  • Enterprise releases with long-term support
  • Integrations with Grafana and OpenTelemetry

Pricing: Single-node and cluster versions are free under Apache-2.0; enterprise support and releases are offered with a free trial license.

Graylog

Graylog is a free, open log management platform written in Java that collects, searches and analyzes logs, with a focus on security use cases.

GitHub stars
8.2k
Last commit
today
Self-hosted
Yes
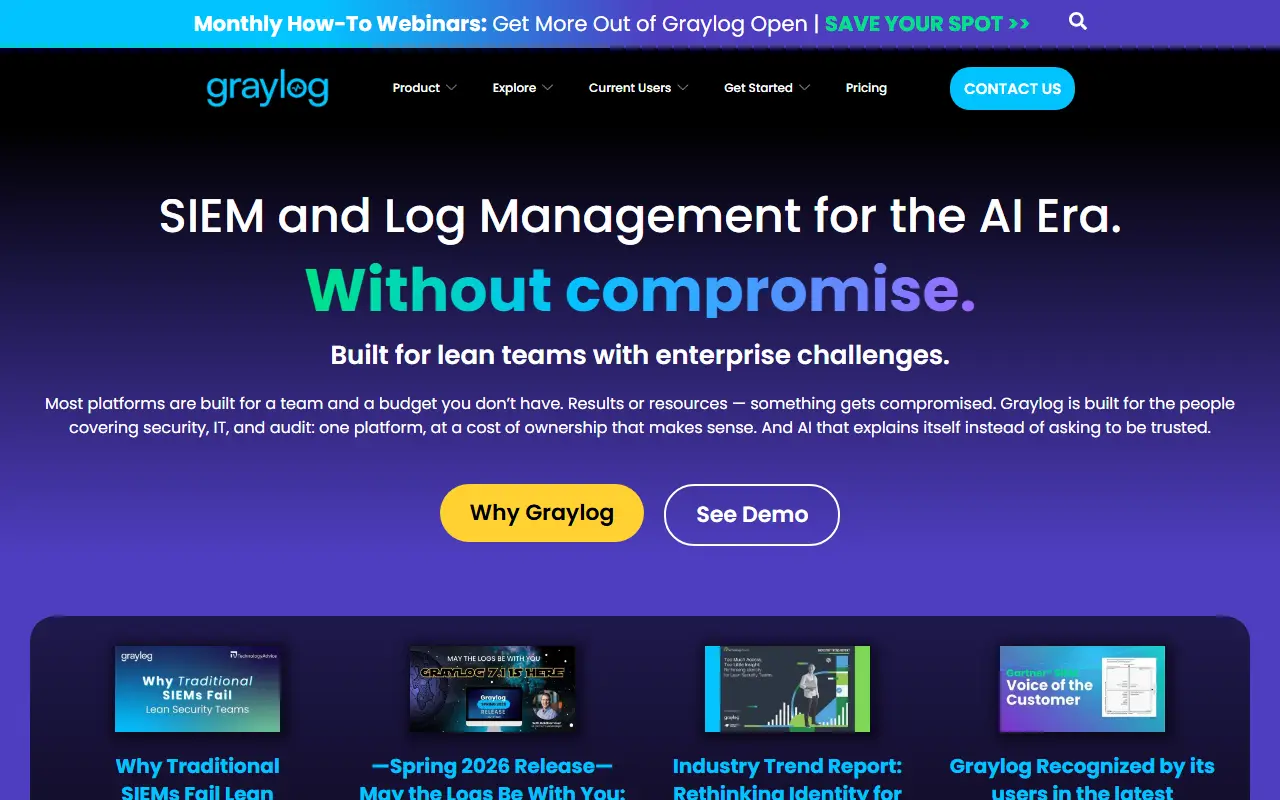
graylog.orgGraylog homepage screenshot

Graylog is a log management server written in Java and described by its maintainers as free and open. It centralizes log data from many systems so teams can search, view and analyze events in one place instead of connecting to each machine individually.

The repository topics point to support for common log formats and transports, including GELF and syslog, along with Kafka and AMQP inputs. Topics also place the project in log analysis, log collection, secure logging and SIEM territory, which reflects its use for monitoring and security work. Specific features were not available when this entry was written, because the vendor website could not be read.

Key features

  • Centralized log collection and search
  • GELF and syslog input formats
  • Kafka and AMQP integration
  • Log analysis and viewing
  • Security-oriented logging

Zabbix

Zabbix is an open-source monitoring platform for networks, servers, virtual machines, applications and cloud services, with discovery and alerting.

GitHub stars
6.4k
Last commit
today
Licence
AGPL-3.0
Self-hosted
Yes
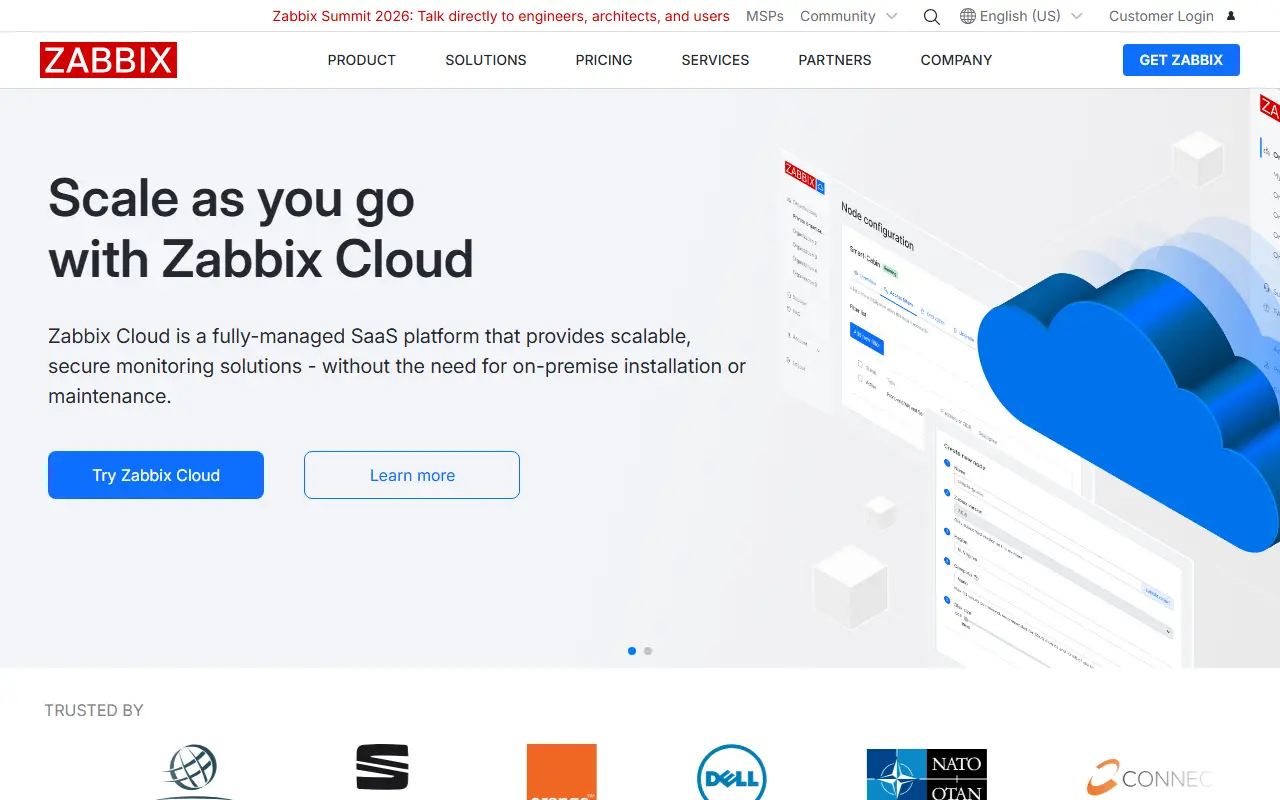
zabbix.comZabbix homepage screenshot

Zabbix is an enterprise-oriented open-source monitoring solution for tracking the performance and availability of network devices, servers, virtual machines, applications and cloud services. It scales from a single standalone application up to large distributed environments.

Its feature set covers resource discovery that finds network entities and onboards or offboards devices, metric collection through agents or agentless methods from devices, sensors, operating systems and virtualization platforms, and ready-made templates for monitoring everything from low-level hardware to SaaS services. It also provides alerting on collected metrics and visualization of the data, and it is used for both network and application monitoring.

Zabbix is licensed under AGPL-3.0 and is typically self-hosted on your own servers, backed by a database. The vendor sells commercial support and services around the free software, which suits IT operations teams that want a single monitoring system for mixed infrastructure.

Key features

  • Automatic discovery of network resources
  • Agent-based and agentless metric collection
  • Out-of-the-box monitoring templates
  • Alerting on metric thresholds
  • Network, server and cloud monitoring
  • Dashboards and data visualization

Pricing: The software is free with no license fee. Optional support subscriptions start at $325 per month for Silver and $825 for Gold, billed annually; higher tiers are quoted.

Sematext alternatives: questions

What is the best open-source alternative to Sematext?
Netdata is the top-ranked open-source alternative to Sematext on Enlisted: An open-source infrastructure monitoring platform that collects per-second metrics with little configuration and adds machine-learning anomaly detection and alerting. Other strong options are Grafana, Prometheus, SigNoz and Grafana Loki.
Are these Sematext alternatives free?
All 10 are open source, so the code is free to use under its licence, and all of them can be self-hosted on your own server or computer. 7 also offer a paid or managed cloud version if you'd rather not host it yourself.
How is this list of Sematext alternatives ranked?
By a score built from GitHub stars, star growth over the last 30 days and how recently the code changed. 10 of these projects shipped code in the last 30 days. Data is refreshed daily, and nobody can pay to move up.

People also look for alternatives to…

View all