
 IBM Instana
 ManageEngine Applications Manager
 Amazon CloudWatch
 Azure Monitor
 Sematext
 Nagios XI
 SolarWinds Network Performance Monitor
 ManageEngine OpManager
 WhatsUp Gold
 Splunk Observability Cloud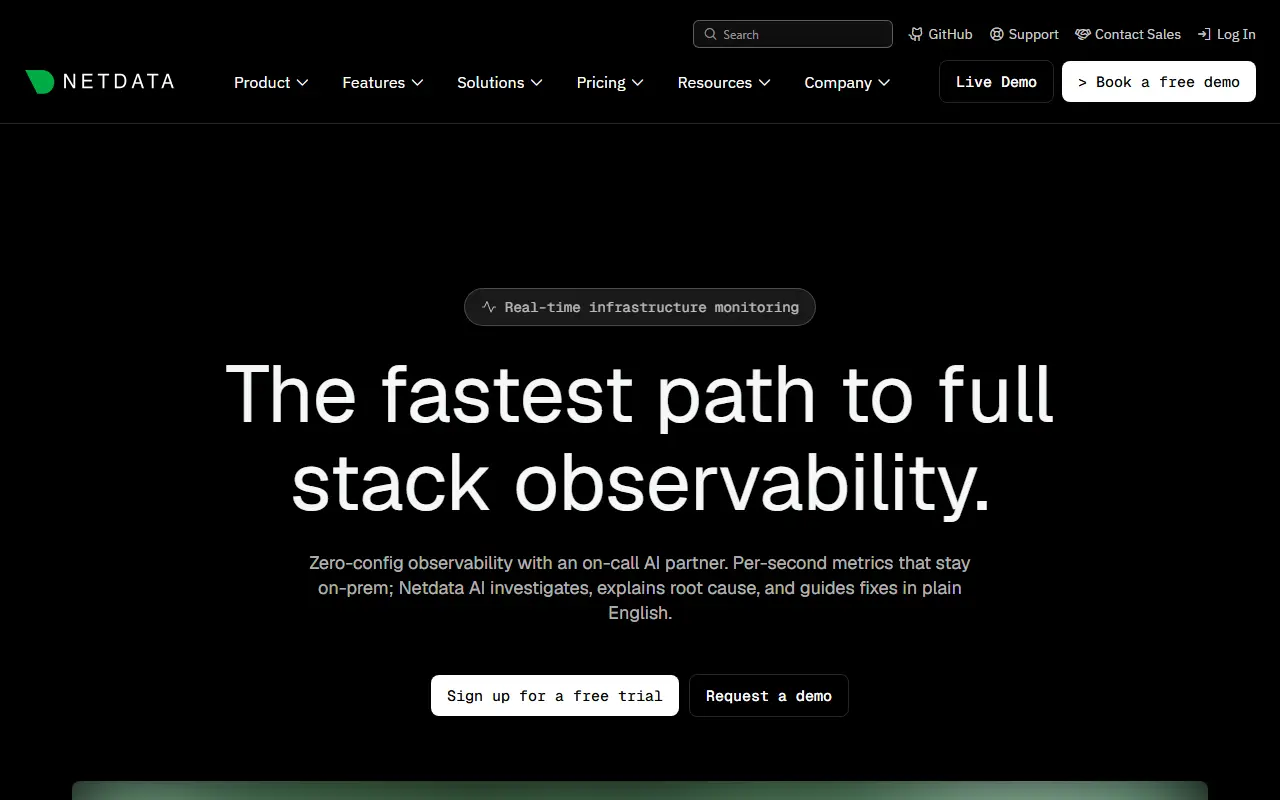
About Netdata
Netdata is a real-time infrastructure monitoring platform. You install an agent on servers, containers or Kubernetes nodes and it starts collecting metrics every second, showing them on dashboards without lengthy setup. Its origin story is a frustration with monitoring tools that offered few metrics at low resolution and cost too much to run.
The project highlights zero-configuration deployment, machine-learning-based anomaly detection and automated analysis, and an efficient agent that uses few resources. Data stays distributed on the monitored machines instead of being shipped to one central store. Integrations cover databases such as MySQL, PostgreSQL and MongoDB, plus Docker and Kubernetes, and the topics list mentions export paths to Prometheus, Grafana and InfluxDB. Netdata also advertises AI-assisted troubleshooting and an MCP interface.
The agent is GPL-3.0 licensed and written largely in Go, and Netdata Cloud offers a hosted layer for viewing many nodes together. It suits operations teams and lean engineering groups that want deep visibility quickly rather than building a metrics stack from several separate tools.
Key features
- Per-second metrics for servers and containers
- Zero-configuration agent deployment
- Machine-learning anomaly detection
- Alerting on infrastructure issues
- Database, Docker and Kubernetes monitoring
- Distributed storage that keeps data local
Good fit for
- →Monitoring Linux servers and containers
- →Troubleshooting performance incidents live
- →Giving small ops teams quick observability
- Tags
- monitoring
- observability
- metrics
- devops
- kubernetes
- docker
- alerting
- anomaly-detection
- self-hosted
Netdata: questions and answers
- What is Netdata used for?
- Netdata is an open-source infrastructure monitoring platform that collects per-second metrics with little configuration and adds machine-learning anomaly detection and alerting. It is a good fit for monitoring Linux servers and containers, troubleshooting performance incidents live, and giving small ops teams quick observability.
- Is Netdata open source?
- Yes. Netdata is open source under the GPL-3.0 licence. Its source code is on GitHub at netdata/netdata and is written mainly in Go.
- Is Netdata free?
- Yes. Netdata is open source, so the software itself is free to use. A managed cloud version is also available, with paid plans from $4.50 per seat per month.
- Can I self-host Netdata?
- Yes. Netdata can be self-hosted on your own server or infrastructure.
- What is Netdata an alternative to?
- Netdata is an open-source alternative to Datadog, Dynatrace, LogicMonitor and PRTG Network Monitor. Other open-source alternatives to Datadog include Zabbix, SigNoz and Nagios Core.
- Is Netdata actively maintained?
- Yes. The most recent commit to Netdata was on 2 October 2026, and the latest release is v2.12.0, published on 30 September 2026. The project has 81k stars on GitHub.
Open-source alternatives to Netdata
See all
Zabbix
Monitoring & Observability
Real-time monitoring of IT components and services, such as networks, servers, VMs, applic
AGPL-3.0vs Datadog★ 6.4k
SigNoz
Monitoring & Observability
SigNoz Cloud is a one-stop observability tool built on top of OpenTelemetry. Get APM, logs
OSSvs Datadog★ 32k
Nagios Core
Monitoring & Observability
Nagios Core
GPL-2.0vs Datadog★ 2k
Apache HertzBeat
Monitoring & Observability
AI-powered open source real-time monitoring system for metrics, logs, alerts, and observab
Apache-2.0vs Datadog★ 7.4k
Checkmk
Monitoring & Observability
Checkmk - Best-in-class infrastructure & application monitoring
GPL-2.0vs Datadog★ 2.4k
Icinga 2
Monitoring & Observability
The core of our monitoring platform with a powerful configuration language and REST API.
GPL-3.0vs Datadog★ 2.2k
SaaS alternatives to Netdata
See all
Datadog
Monitoring & Observability
Datadog is a cloud monitoring and observability platform that brings metrics, logs and traces from applications, tools and services into one place.
SaaS
Dynatrace
Monitoring & Observability
Full-stack observability with automatic instrumentation and AI-based root-cause analysis
SaaS
LogicMonitor
Monitoring & Observability
Agentless hybrid infrastructure monitoring with automated device discovery
SaaS
PRTG Network Monitor
Monitoring & Observability
Windows-based network, server and bandwidth monitoring from Paessler
SaaS
New Relic
Monitoring & Observability
Observability platform for application performance, infrastructure and logs
SaaS
Site24x7
Monitoring & Observability
Zoho all-in-one monitoring for websites, servers, cloud services and applications
SaaS