7,363 open-source and SaaS tools, with GitHub stats refreshed every day.

9 alternatives ranked by real activity

Open-source ManageEngine OpManager alternatives

A curated, ranked list of the 9 best open-source alternatives to ManageEngine OpManager.

The best open-source alternative to ManageEngine OpManager is Netdata. If that doesn't suit you, other good options are Apache HertzBeat, Zabbix, WGCLOUD and LibreNMS.

ManageEngine OpManager alternatives are mainly monitoring & observability tools. 8 of them shipped code in the last 30 days, 9 can be self-hosted, and 2 use a permissive licence.

Last updated October 3, 2026 · ranked by GitHub stars, growth and recent commits

Netdata

An open-source infrastructure monitoring platform that collects per-second metrics with little configuration and adds machine-learning anomaly detection and alerting.

GitHub stars
81k
Last commit
yesterday
Latest release
v2.12.0
Licence
GPL-3.0
Self-hosted
Yes
Hosted version
Available
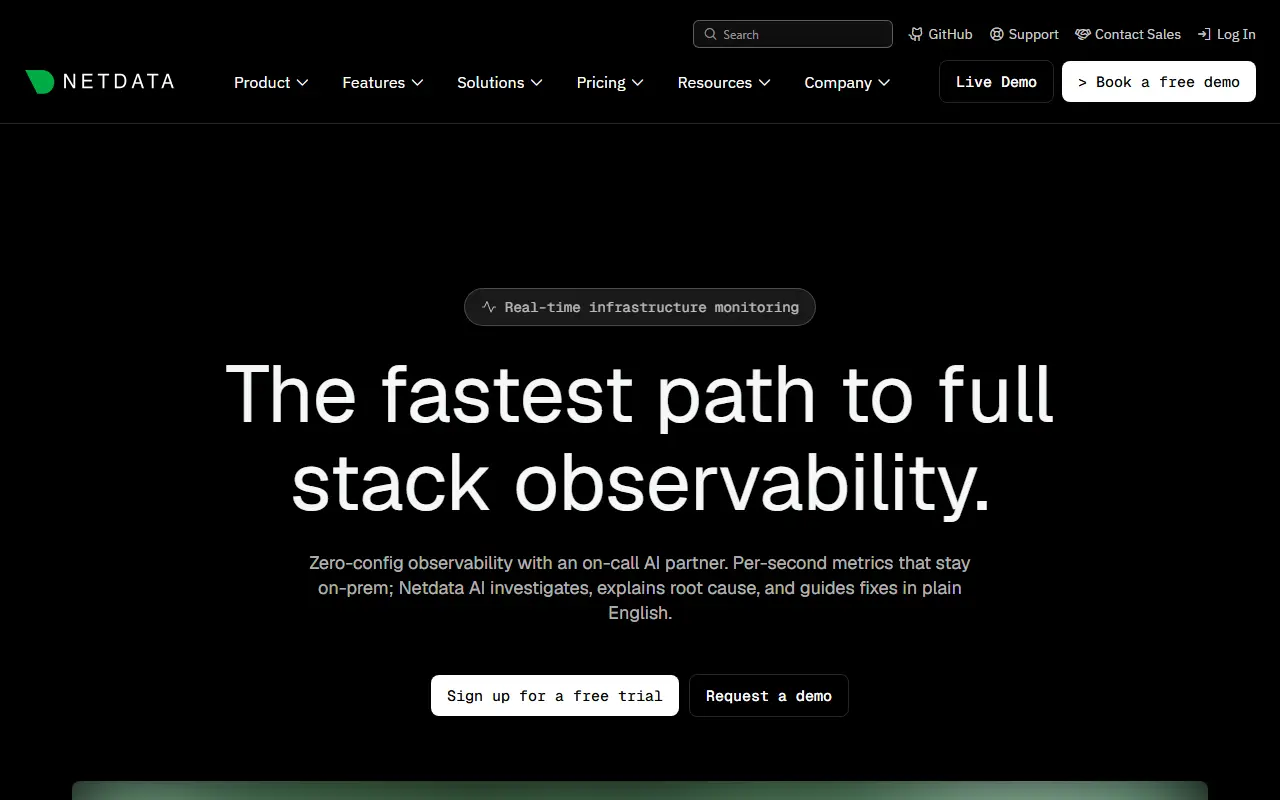
netdata.cloudNetdata homepage screenshot

Netdata is a real-time infrastructure monitoring platform. You install an agent on servers, containers or Kubernetes nodes and it starts collecting metrics every second, showing them on dashboards without lengthy setup. Its origin story is a frustration with monitoring tools that offered few metrics at low resolution and cost too much to run.

The project highlights zero-configuration deployment, machine-learning-based anomaly detection and automated analysis, and an efficient agent that uses few resources. Data stays distributed on the monitored machines instead of being shipped to one central store. Integrations cover databases such as MySQL, PostgreSQL and MongoDB, plus Docker and Kubernetes, and the topics list mentions export paths to Prometheus, Grafana and InfluxDB. Netdata also advertises AI-assisted troubleshooting and an MCP interface.

The agent is GPL-3.0 licensed and written largely in Go, and Netdata Cloud offers a hosted layer for viewing many nodes together. It suits operations teams and lean engineering groups that want deep visibility quickly rather than building a metrics stack from several separate tools.

Key features

  • Per-second metrics for servers and containers
  • Zero-configuration agent deployment
  • Machine-learning anomaly detection
  • Alerting on infrastructure issues
  • Database, Docker and Kubernetes monitoring
  • Distributed storage that keeps data local

Pricing: The agent is free and Community covers up to 5 nodes. Homelab costs $90 per year for unlimited nodes and Business $4.50 per node per month billed annually.

Read more about NetdataWebsite GitHub

Apache HertzBeat

Apache HertzBeat is an agentless, AI-assisted observability system that unifies metrics and log collection, alerting and notifications, with status pages.

GitHub stars
7.4k
Last commit
3 days ago
Latest release
v1.9.0
Licence
Apache-2.0
Self-hosted
Yes
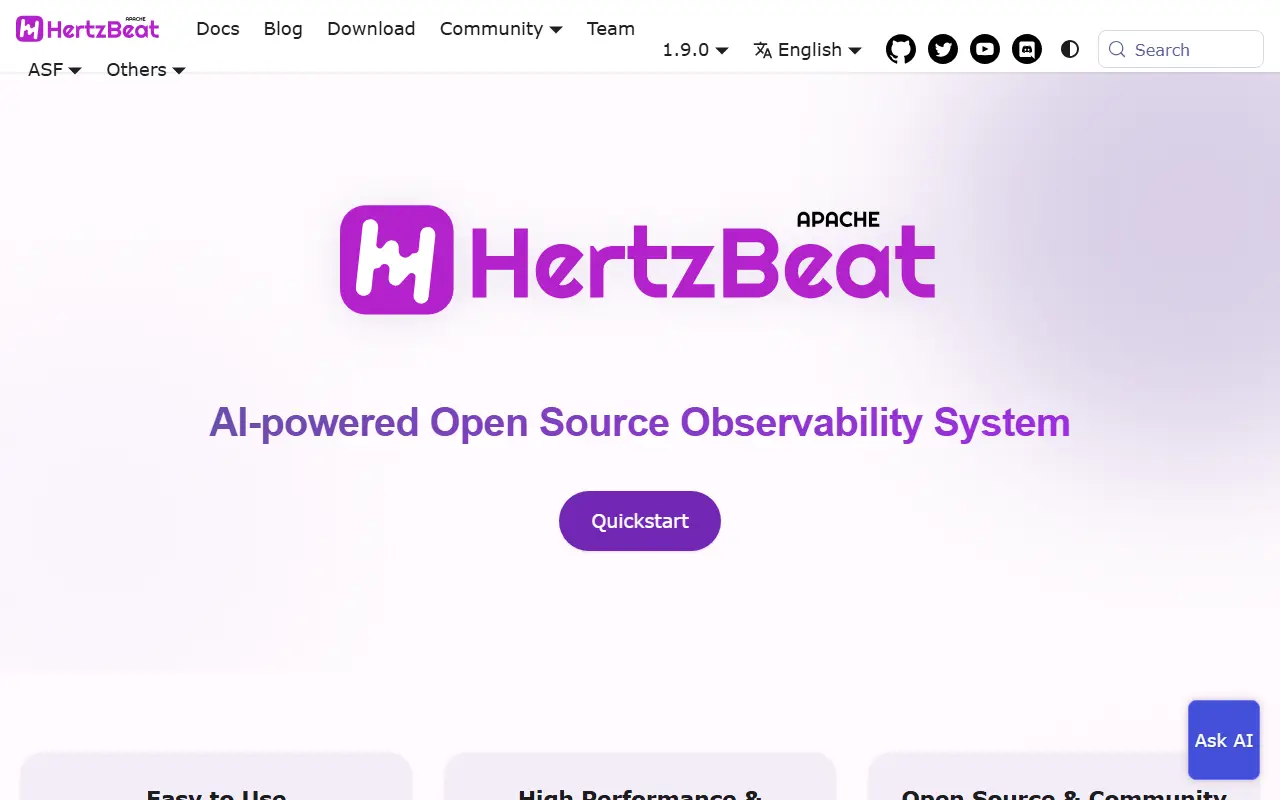
hertzbeat.apache.orgApache HertzBeat homepage screenshot

Apache HertzBeat is an open-source real-time observability system that describes itself as AI-powered. It brings collection, analysis, alerting and notification into one platform, works without agents on the monitored hosts, and can be scaled out with collector clusters. It also includes built-in MCP server capabilities and AI-powered interactions under the name HertzBeat AI.

The metrics platform is Prometheus-compatible and covers application services, databases and caches, operating systems, middleware, web servers, big data stacks, cloud-native components and networks. Protocols such as HTTP, JMX, SSH, SNMP, JDBC and Prometheus are configurable through YAML templates, so new monitoring types such as Kubernetes or Docker can be added online. Logs arrive through OTLP. Alerting supports threshold rules, grouping, silence and suppression, and notifications go to email, Discord, Slack, Telegram, DingTalk, WeChat, Feishu, SMS and webhooks.

Custom monitoring and status page building are included. HertzBeat is an Apache Software Foundation project written in Java and licensed under Apache-2.0, and you run it on your own servers. It suits operations teams that want an all-in-one alternative to Zabbix- or Prometheus-based stacks.

Key features

  • Agentless metrics and log collection
  • Prometheus-compatible metrics platform
  • Monitoring templates configured in YAML
  • Threshold alerting with grouping and silence
  • Notifications via email, Slack and Telegram
  • Status page building
  • MCP server and AI features

Pricing: Free and open source under the Apache-2.0 licence.

Read more about Apache HertzBeatWebsite GitHub

Zabbix

Zabbix is an open-source monitoring platform for networks, servers, virtual machines, applications and cloud services, with discovery and alerting.

GitHub stars
6.4k
Last commit
yesterday
Licence
AGPL-3.0
Self-hosted
Yes
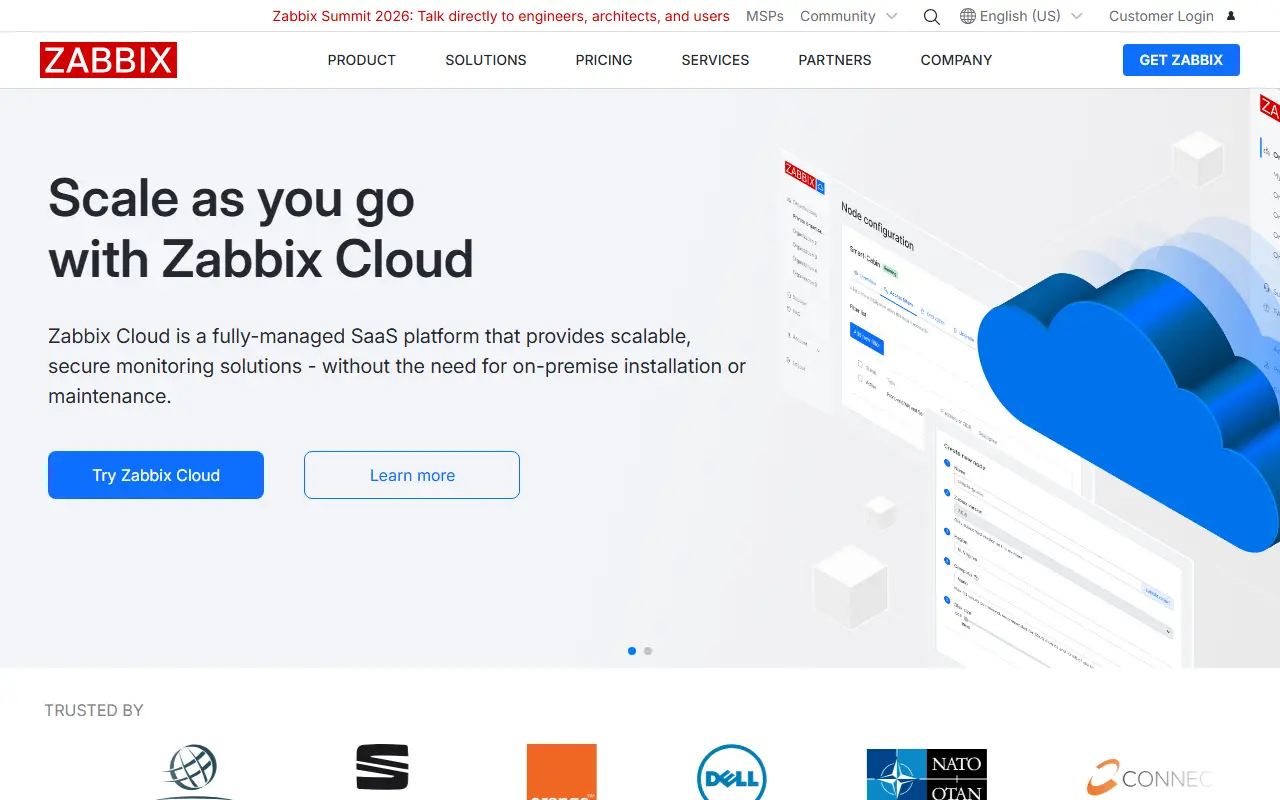
zabbix.comZabbix homepage screenshot

Zabbix is an enterprise-oriented open-source monitoring solution for tracking the performance and availability of network devices, servers, virtual machines, applications and cloud services. It scales from a single standalone application up to large distributed environments.

Its feature set covers resource discovery that finds network entities and onboards or offboards devices, metric collection through agents or agentless methods from devices, sensors, operating systems and virtualization platforms, and ready-made templates for monitoring everything from low-level hardware to SaaS services. It also provides alerting on collected metrics and visualization of the data, and it is used for both network and application monitoring.

Zabbix is licensed under AGPL-3.0 and is typically self-hosted on your own servers, backed by a database. The vendor sells commercial support and services around the free software, which suits IT operations teams that want a single monitoring system for mixed infrastructure.

Key features

  • Automatic discovery of network resources
  • Agent-based and agentless metric collection
  • Out-of-the-box monitoring templates
  • Alerting on metric thresholds
  • Network, server and cloud monitoring
  • Dashboards and data visualization

Pricing: The software is free with no license fee. Optional support subscriptions start at $325 per month for Silver and $825 for Gold, billed annually; higher tiers are quoted.

Read more about ZabbixWebsite GitHub

WGCLOUD

WGCLOUD is a Java-based, agent-driven monitoring platform for Linux servers, networks, containers and services, with alerts and a dashboard.

GitHub stars
5.2k
Last commit
4 days ago
Latest release
v3.7.0
Licence
Apache-2.0
Self-hosted
Yes
wgstart.comWGCLOUD homepage screenshot

WGCLOUD is a lightweight, distributed operations monitoring system built on Spring Boot, with documentation in Chinese. It is designed to deploy quickly and run automatically without templates or scripts, using a server and agent model: the server receives and processes data and draws charts, while agents collect metrics from each host.

Collected metrics cover CPU usage and temperature, memory, disk capacity and I/O, SMART health, load, network traffic, hardware and BIOS details, GPU, firewall state, processes, ports and more. It can also monitor Docker containers, databases, logs and service APIs, detect file tampering, poll network devices through SNMP, draw a network topology, show large-screen dashboards, provide web SSH and run commands in bulk. Alerts can go out by email, DingTalk, WeChat and SMS.

The repository holds the open-source edition under the Apache-2.0 license and is typically deployed on your own servers. It suits operations teams, especially in Chinese-speaking environments, that want an all-in-one monitor without assembling several tools.

Key features

  • Server and agent monitoring architecture
  • CPU, memory, disk and GPU metrics
  • Docker, database and log monitoring
  • SNMP network device monitoring
  • Network topology and big-screen dashboards
  • Alerts via email, DingTalk and WeChat

Pricing: The open-source edition is free under Apache-2.0.

Read more about WGCLOUDWebsite GitHub

LibreNMS

LibreNMS is a community-driven, auto-discovering network monitoring system built on PHP, MySQL and SNMP for a wide range of network hardware.

GitHub stars
4.9k
Last commit
yesterday
Latest release
26.9.1.1
Self-hosted
Yes
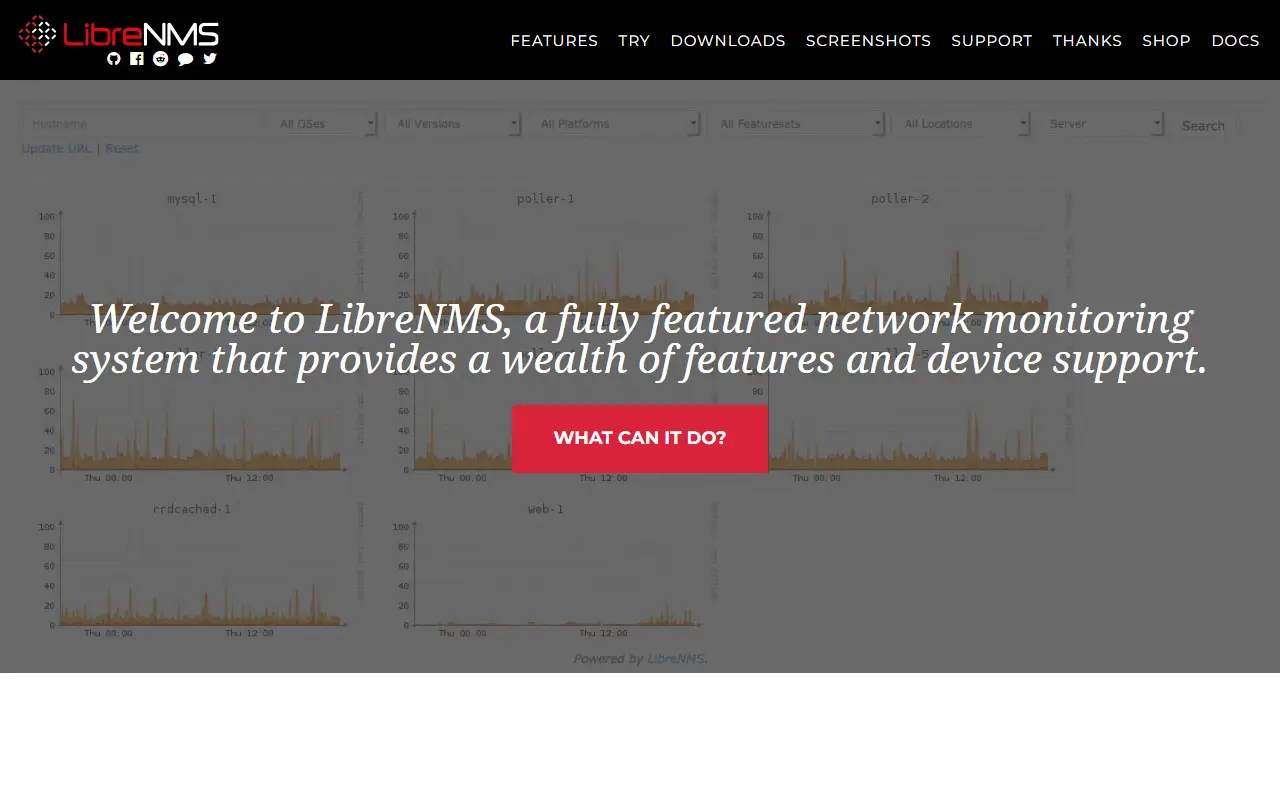
librenms.orgLibreNMS homepage screenshot

LibreNMS is a network monitoring system that automatically discovers devices and tracks them over SNMP. It is built with PHP and MySQL and supports many kinds of network gear and operating systems, such as Cisco, Linux, FreeBSD, Juniper, Brocade, Foundry and HP equipment. Administrators use it to keep an eye on routers, switches, servers and other networked equipment.

The project describes itself as a community effort that welcomes contributions, puts users' needs first and aims to be friendly, using the Debian Social Contract as the basis of its priorities. The code is a Laravel application, with RRD-based graphing mentioned in the repository topics, and extensive documentation is published on the project site.

The tagline calls it a GPL-licensed system, although GitHub reports the license as 'Other'. LibreNMS is installed on your own server, and there is no hosted version provided by the project. It suits network administrators, ISPs and IT teams that want a free alternative to commercial network monitoring suites.

Key features

  • Automatic network device discovery
  • Monitoring of devices over SNMP
  • Support for Cisco, Juniper, HP and Linux devices
  • RRD graphs of device metrics
  • Alerting for network events
  • Laravel-based web interface

Pricing: Free and open source under a GPL license.

Read more about LibreNMSWebsite GitHub

Checkmk

Scalable IT monitoring system for infrastructure and applications across physical, virtual, container, and cloud environments, with a free open-source Community edition.

GitHub stars
2.4k
Last commit
yesterday
Licence
GPL-2.0
Self-hosted
Yes
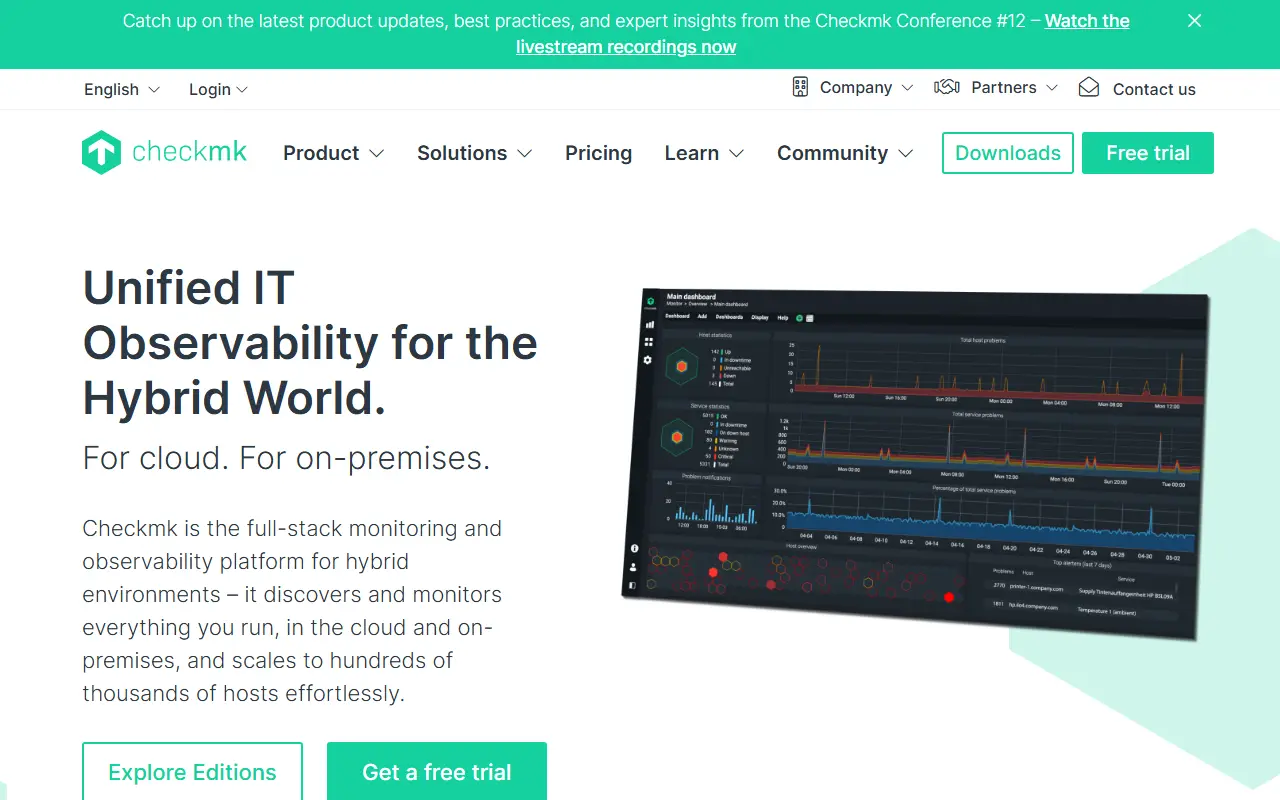
checkmk.comCheckmk homepage screenshot

Checkmk is a comprehensive IT monitoring system designed for scalability, flexibility, and low resource consumption. It monitors infrastructure and applications across physical servers, virtual machines, containers, and cloud environments. It is written mainly in Python.

The Checkmk Community edition is free and open source under the GNU GPL v2. It includes the core monitoring engine, a web-based interface, agent-based and agentless monitoring, and support for hundreds of official and community plugins, and is suited to smaller environments with basic automation, dashboarding, and support needs. Commercial editions extend it: Pro adds distributed monitoring, built-in dashboards, automated agent management, enterprise integrations such as LDAP and REST APIs, and professional support, and Ultimate adds enhanced monitoring for dynamic cloud-native environments such as Kubernetes, AWS, Azure, and GCP.

The website provides documentation, releases, and discussion forums, and a demo of the Pro edition can be downloaded for evaluation. Checkmk suits IT operations teams and managed service providers that want a single tool for servers, networks, and applications.

Key features

  • Agent-based and agentless monitoring
  • Web-based interface
  • Hundreds of official and community plugins
  • Distributed monitoring in the commercial Pro edition
  • Cloud-native monitoring in the Ultimate edition
  • Low resource consumption design

Pricing: The Community edition is free. Pro starts at €190 and Ultimate at €275 per month billed annually, with free trials; the Cloud (SaaS) edition is listed at €240 per month on monthly billing.

Read more about CheckmkWebsite GitHub

Icinga 2

Icinga 2 is a scalable monitoring server that checks availability of network resources, sends outage notifications, and records performance data.

GitHub stars
2.2k
Last commit
2 days ago
Latest release
v2.16.5
Licence
GPL-3.0
Self-hosted
Yes
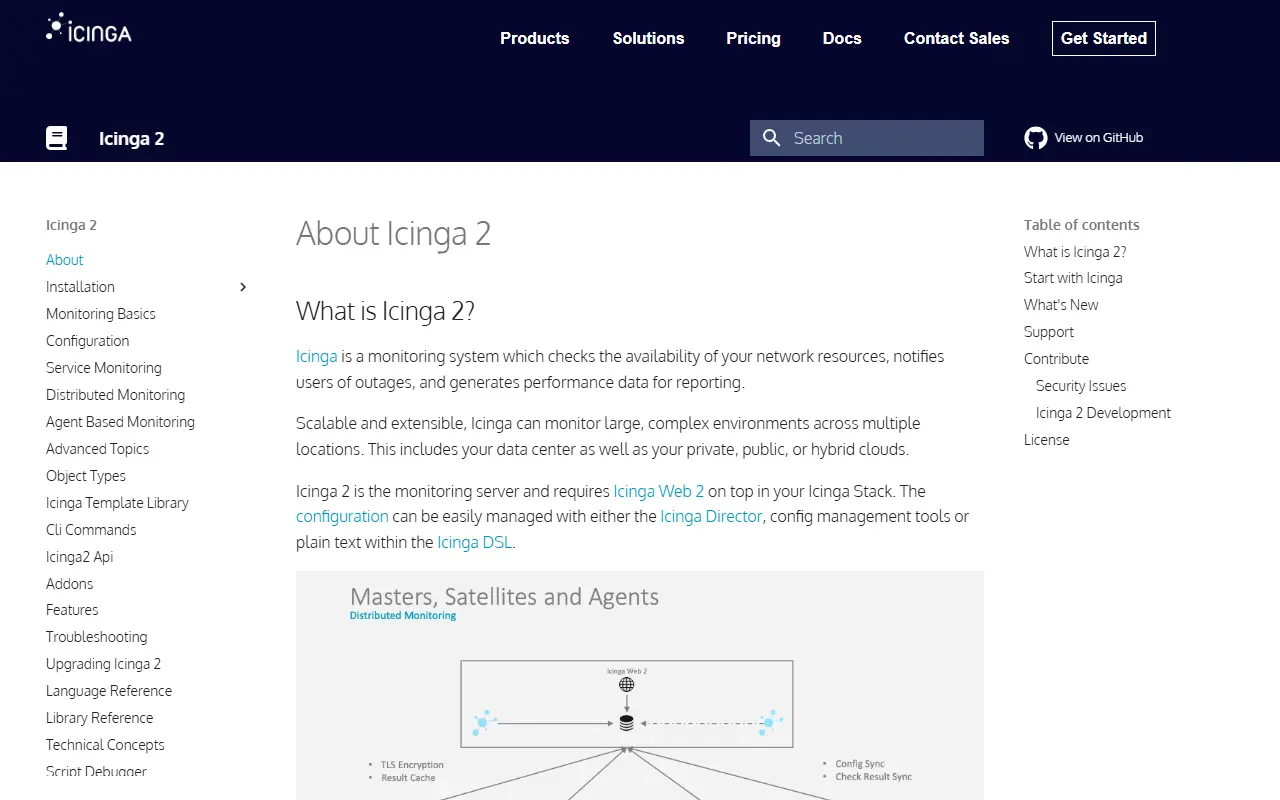
icinga.comIcinga 2 homepage screenshot

Icinga 2 is the core of the Icinga monitoring platform. It checks the availability of network resources, notifies users of outages, and generates performance data for reporting. It is built to scale and can monitor large, complex environments spanning multiple locations. The code is written in C++ and released under the GPL-3.0 license as stated in the input.

Configuration can be managed with the Icinga Director, with configuration management tools, or as plain text in the Icinga DSL, a powerful configuration language. The server offers a REST API, TLS-secured distributed monitoring with clustering, and integrations with metrics and logging backends such as Elastic, Graylog, InfluxDB, Graphite, and OpenTSDB. Icinga Web 2 is required on top for the web interface.

The README links to installation, monitoring basics, configuration, and distributed monitoring documentation. Icinga suits system administrators and operations teams who need a mature, configurable monitoring system for servers, networks, and services, especially those that want infrastructure-as-code style configuration.

Key features

  • Availability checks for network resources
  • Outage notifications
  • Performance data generation
  • Distributed monitoring with clustering
  • REST API and configuration DSL
  • Integrations with InfluxDB, Graphite, and Elastic

Pricing: The core is free and open source. Optional subscriptions are €5,000 per year for enterprise Linux packages, €2,000 for enterprise modules and from €15,000 for support, with a 60-day trial on the repository subscription.

Read more about Icinga 2Website GitHub

Cacti

Cacti is an open-source network monitoring and graphing platform built on RRDtool, collecting time-series data from devices and servers.

GitHub stars
1.9k
Last commit
today
Latest release
release/1.2.31
Licence
GPL-2.0
Self-hosted
Yes
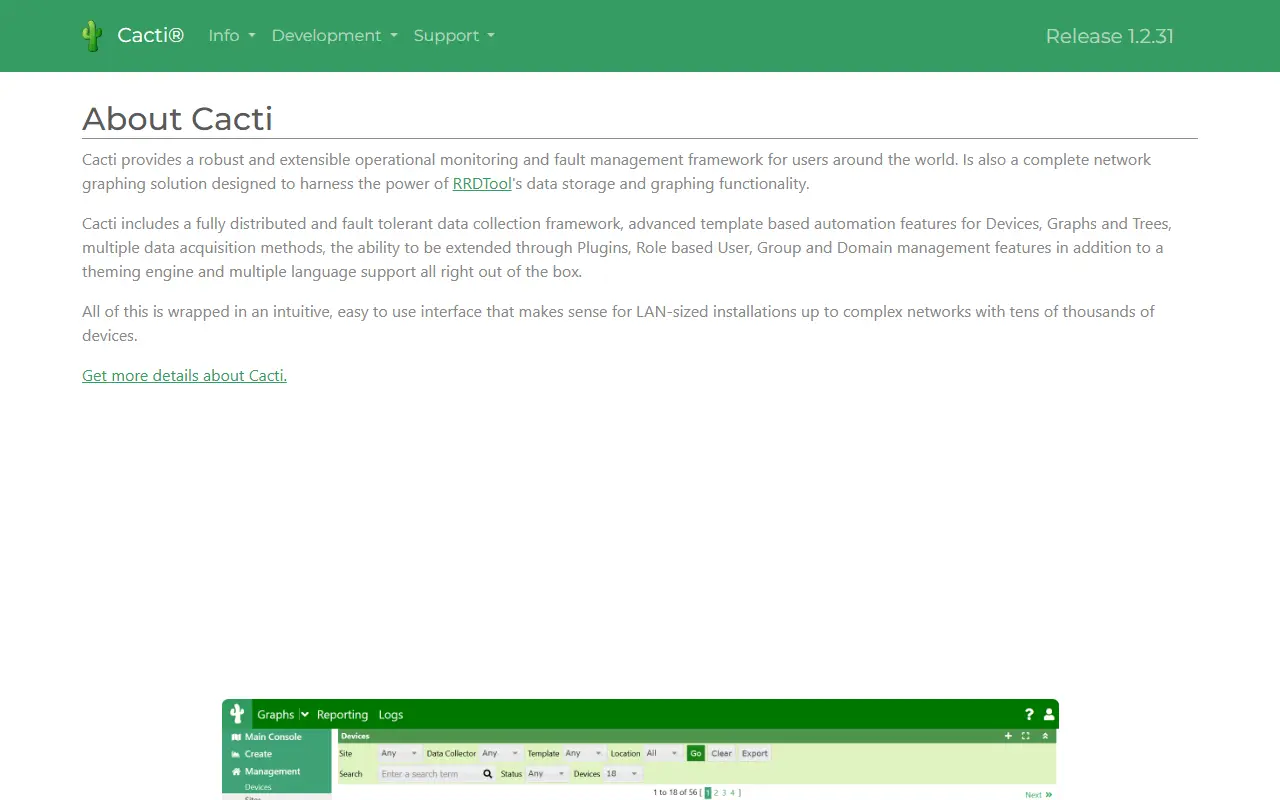
cacti.netCacti homepage screenshot

Cacti is an open-source network monitoring and graphing platform built on RRDtool. It provides a scalable framework for collecting, storing and visualizing time-series data from network devices, servers and applications. It is a PHP application, licensed under GPL-2.0, that is typically installed on a web server alongside MariaDB or MySQL.

Core capabilities listed in the README include automated device discovery, local and remote data collection, templating for graphs, data sources and round-robin archives, SNMP polling across versions 1, 2 and 3 with IPv6 support, role-based access control, a plugin framework and dynamic graph viewing and export. Scheduled polling and maintenance scripts run through PHP on the command line or CGI.

The project maintains a stable 1.2.x branch and a develop branch heading toward 1.3.x, with different minimum requirements for MariaDB, MySQL, PHP, RRDtool and Net-SNMP in each. Red Hat family distributions are a common baseline, and Debian and Ubuntu are well supported. Installation from a source checkout is described in the README, with the latest release published on GitHub.

Key features

  • RRDtool-based graphing of time-series data
  • Automated device discovery
  • SNMP v1, v2 and v3 polling with IPv6
  • Templates for graphs and data sources
  • Role-based access control
  • Plugin framework

Pricing: Free and open source under the GPL-2.0 license.

Read more about CactiWebsite GitHub

Nagios Core

Long-running host, service and network monitoring program written in C, with plugins, alerting and an optional web interface.

GitHub stars
2k
Last commit
1 mo ago
Latest release
nagios-4.5.14
Licence
GPL-2.0
Self-hosted
Yes

Nagios Core is a monitoring program for hosts, services and networks, written in C and released under the GNU General Public License version 2. It checks whether your systems and services are working and tells you when something goes wrong or recovers.

It can monitor network services such as SMTP, POP3, HTTP and ping, as well as host resources like processor load and disk usage. A plugin interface lets you write your own checks. You can define a host hierarchy with parent hosts, which lets Nagios tell hosts that are down apart from hosts that are only unreachable. Notifications go out by email, pager or a user-defined method, and event handlers allow automatic responses to problems.

Other features include automatic log file rotation and archiving, plus CGI programs that provide an optional web interface for current status, notification history and logs. Documentation, quickstart installation guides, a user guide and support forums are available from the Nagios site. Paid Nagios products exist separately from this open-source core.

Key features

  • Monitors network services such as HTTP and SMTP
  • Tracks host resources like CPU load and disk
  • Plugin interface for custom checks
  • Parent host hierarchy to separate down from unreachable
  • Email, pager and custom notifications
  • Event handlers for automated responses
  • Optional web interface for status and history

Pricing: Free and open source under GPL-2.0; documentation and community forums are available.

Read more about Nagios CoreGitHub

ManageEngine OpManager alternatives: questions

What is the best open-source alternative to ManageEngine OpManager?
Netdata is the top-ranked open-source alternative to ManageEngine OpManager on Enlisted: An open-source infrastructure monitoring platform that collects per-second metrics with little configuration and adds machine-learning anomaly detection and alerting. Other strong options are Apache HertzBeat, Zabbix, WGCLOUD and LibreNMS.
Are these ManageEngine OpManager alternatives free?
All 9 are open source, so the code is free to use under its licence, and all of them can be self-hosted on your own server or computer. 1 also offers a paid or managed cloud version if you'd rather not host it yourself.
How is this list of ManageEngine OpManager alternatives ranked?
By a score built from GitHub stars, star growth over the last 30 days and how recently the code changed. 8 of these projects shipped code in the last 30 days. Data is refreshed daily, and nobody can pay to move up.

People also look for alternatives to…

View all