7,363 open-source and SaaS tools, with GitHub stats refreshed every day.

10 alternatives ranked by real activity

Open-source Sumo Logic alternatives

A curated, ranked list of the 10 best open-source alternatives to Sumo Logic.

The best open-source alternative to Sumo Logic is SigNoz. If that doesn't suit you, other good options are Grafana Loki, OpenObserve, Kibana and Quickwit.

Sumo Logic alternatives are mainly monitoring & observability tools, but some are also security tools. 10 of them shipped code in the last 30 days, 10 can be self-hosted, and 4 use a permissive licence.

Last updated October 2, 2026 · ranked by GitHub stars, growth and recent commits

SigNoz

An open-source observability platform built on OpenTelemetry that unifies APM, logs, metrics, traces, alerts and dashboards in one tool, self-hosted or in the cloud.

GitHub stars
32k
Last commit
today
Latest release
v0.144.0
Self-hosted
Yes
Hosted version
Available
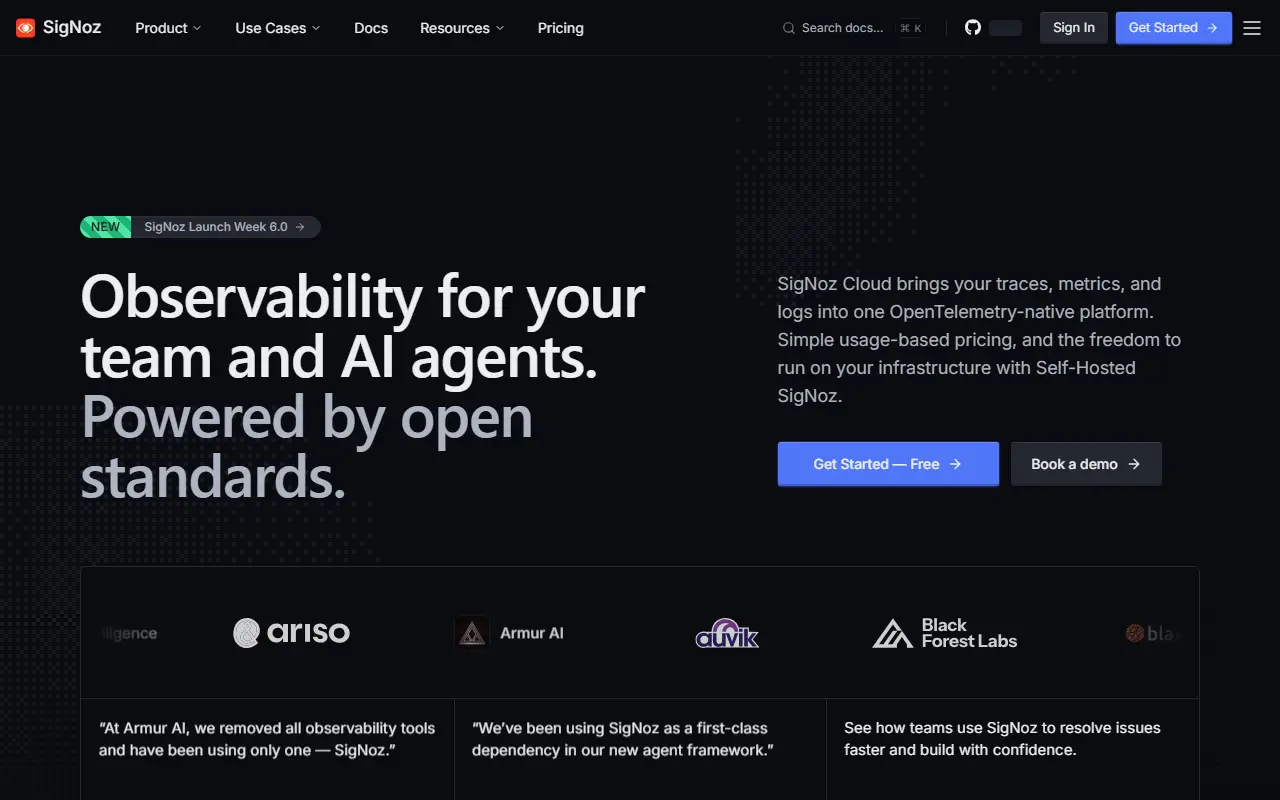
signoz.ioSigNoz homepage screenshot

SigNoz is an observability platform, open source and built on OpenTelemetry. It aims to replace a fragmented monitoring stack with a single place for logs, metrics, traces, alerts, exceptions and dashboards, and it presents itself as useful for both engineering teams and their AI agents.

The APM view follows how each service performs, covering latency, error rate, throughput, Apdex, the busiest endpoints, and calls to databases and external services. Log management supports ingesting, searching and correlating logs with traces and metrics through a visual query builder. Dashboards can be built with a query builder, PromQL or ClickHouse SQL, infrastructure monitoring covers Kubernetes clusters, pods, nodes and host resources, and LLM and AI observability traces prompts, tool calls, tokens, latency and cost.

You can choose how to run it. SigNoz Cloud is fully managed, with a 30-day free trial and usage-based pricing that starts at $49. Enterprise options cover cloud, bring-your-own-cloud and self-hosted deployments with extra support and controls. The free Community edition runs in your own infrastructure via Docker, Kubernetes or Linux. The repository license is listed as 'Other' on GitHub.

Key features

  • OpenTelemetry-native logs, metrics and traces
  • APM with latency, error rate and Apdex
  • Log management with a visual query builder
  • Dashboards via query builder, PromQL or SQL
  • Kubernetes infrastructure monitoring
  • LLM and AI application observability
  • Alerts and exception tracking

Pricing: Self-hosted Community is free. SigNoz Cloud Teams starts at $49 per month including $49 of usage, then usage-based per GB; Enterprise is custom and starts at $4000 per month.

Read more about SigNozWebsite GitHub

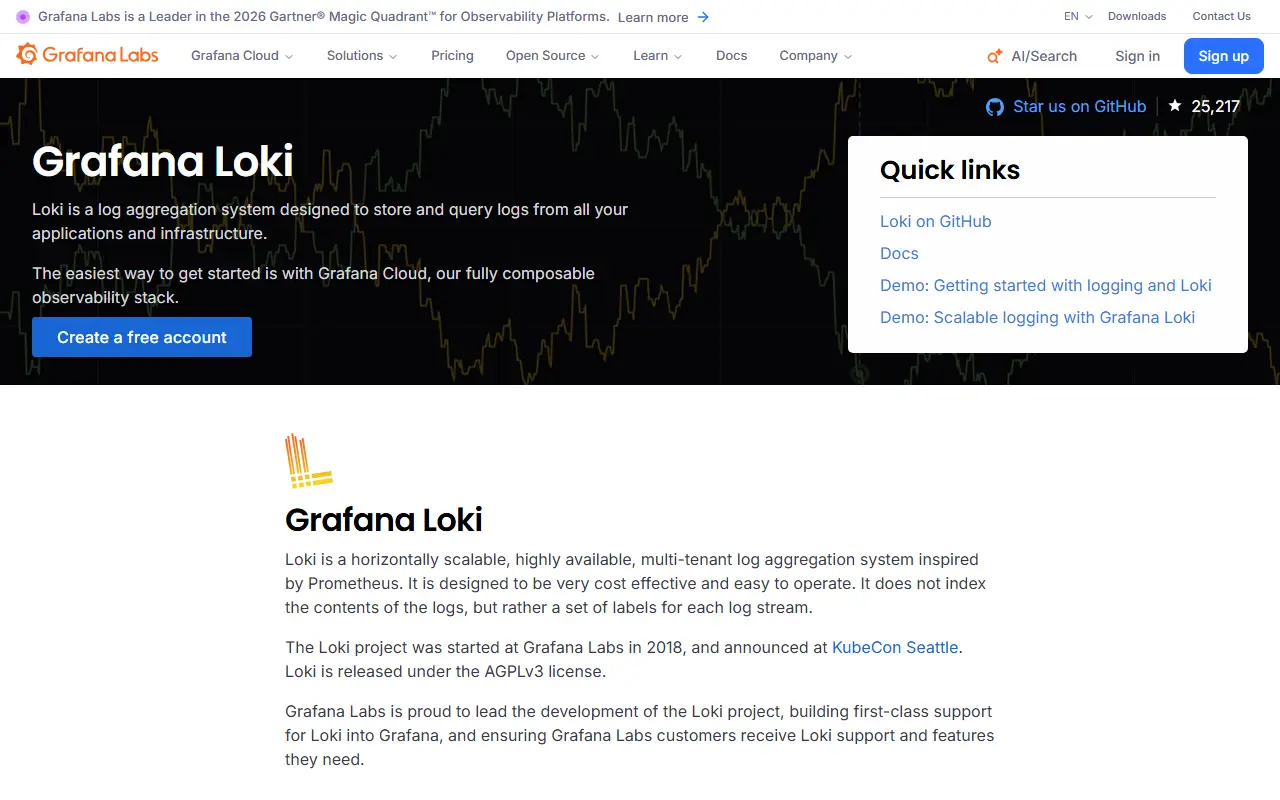
Grafana Loki

Grafana Loki is a horizontally scalable log aggregation system that indexes labels instead of log contents, inspired by Prometheus.

GitHub stars
29k
Last commit
today
Latest release
v3.7.8
Licence
AGPL-3.0
Self-hosted
Yes
Hosted version
Available
grafana.comGrafana Loki homepage screenshot

Loki is a log aggregation system from Grafana, described as Prometheus for logs. It is horizontally scalable, highly available and multi-tenant. Instead of indexing the contents of log lines, it indexes a set of labels for each log stream and stores the compressed log text, which the project says makes it simpler to operate and cheaper to run. It is written in Go and released under the AGPL-3.0 license.

Because Loki reuses the labels familiar from Prometheus, you can move between metrics and logs using the same label sets, and it has native support in Grafana. It works especially well for Kubernetes pod logs, since metadata such as pod labels is scraped and indexed automatically. A typical stack has three parts: Alloy as the collection agent, Loki for storage and queries, and Grafana for exploration. Alloy replaces Promtail, which is considered feature complete. Unlike Prometheus, Loki receives logs by push.

Key features

  • Label-based indexing instead of full-text indexing
  • Horizontally scalable, multi-tenant architecture
  • Native Grafana integration for querying logs
  • Automatic Kubernetes pod label indexing
  • Grafana Alloy agent for log collection
  • Single-binary deployment option

Pricing: Free and open source under the AGPL-3.0 license.

OpenObserve

A cloud-native observability platform covering logs, metrics, traces, RUM and LLM monitoring, with Parquet columnar storage on S3 and a pitch against Datadog and Splunk.

GitHub stars
22k
Last commit
today
Latest release
v1.1.0-rc1
Licence
AGPL-3.0
Self-hosted
Yes
Hosted version
Available
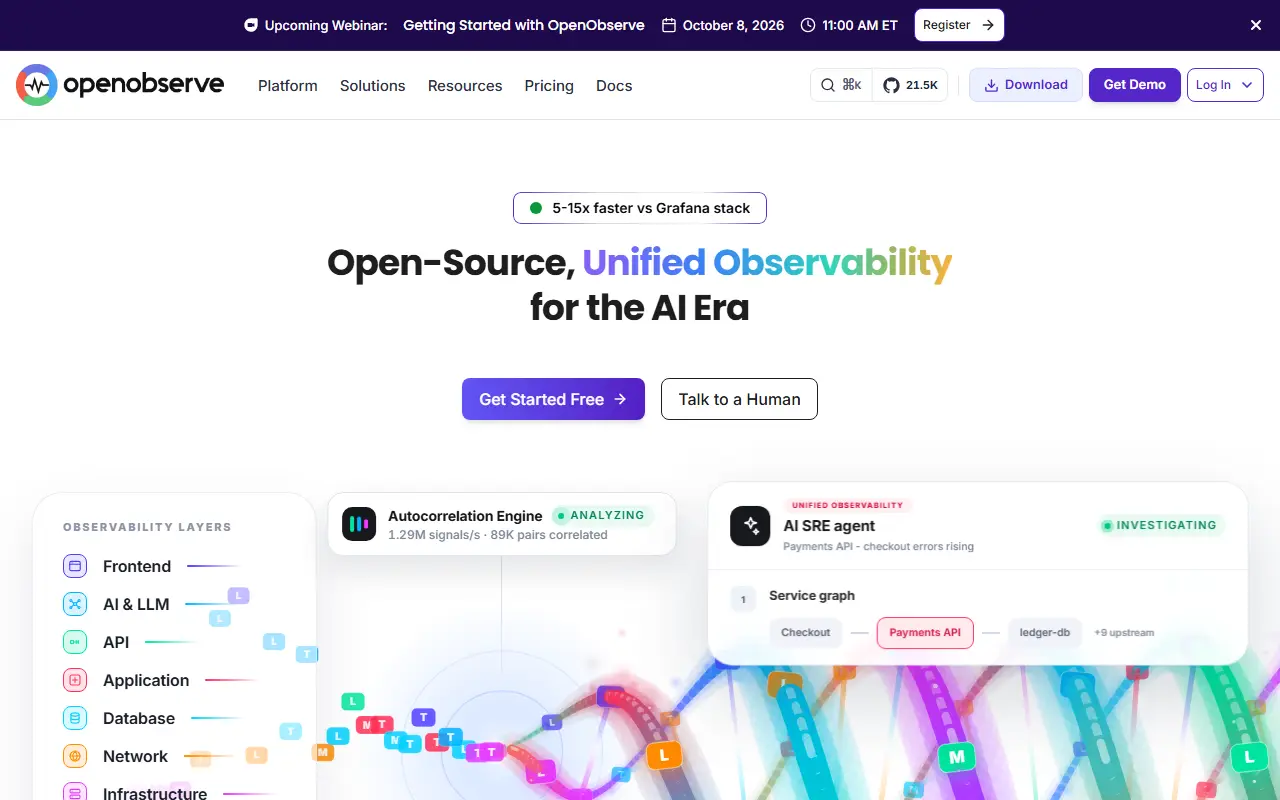
openobserve.aiOpenObserve homepage screenshot

OpenObserve, often shortened to O2, is open-source observability software spanning logs, metrics, traces and analytics, real user monitoring on web, Android and iOS, session replay, pipelines, SLOs and AI and LLM observability. It is pitched as a lower-cost option next to Datadog, Splunk and Elasticsearch for teams that want complete observability without the complexity or price.

Its architecture uses Parquet columnar storage and an S3-native design, which the project says can cut storage costs by up to 140 times compared with Elasticsearch, with petabyte-scale capacity. Topics reference OpenTelemetry, Prometheus, Jaeger and Kibana, showing the standards and tools it interoperates with. The README has sections on architecture, comparisons, production readiness, security and compliance, and an enterprise edition.

OpenObserve is AGPL-3.0 licensed, with a hosted cloud option and a self-hosted deployment, and documentation and a Slack community are provided. It suits engineering teams looking to consolidate logging, metrics and tracing in one tool while keeping storage costs under control.

Key features

  • Logs, metrics and traces in one platform
  • Real user monitoring and session replay
  • LLM and AI observability
  • Parquet columnar storage on S3
  • OpenTelemetry and Prometheus compatibility
  • Pipelines and SLO tracking

Pricing: Self-hosting is free. Cloud is pay-as-you-go at $0.50 per GB ingested plus $0.01 per GB queried, with unlimited users and a 14-day trial; Enterprise is custom.

Kibana

Kibana is the web interface for querying, visualizing and managing data stored in Elasticsearch, used for dashboards, observability and analytics.

GitHub stars
21k
Last commit
today
Latest release
v9.5.4
Self-hosted
Yes
Hosted version
Available
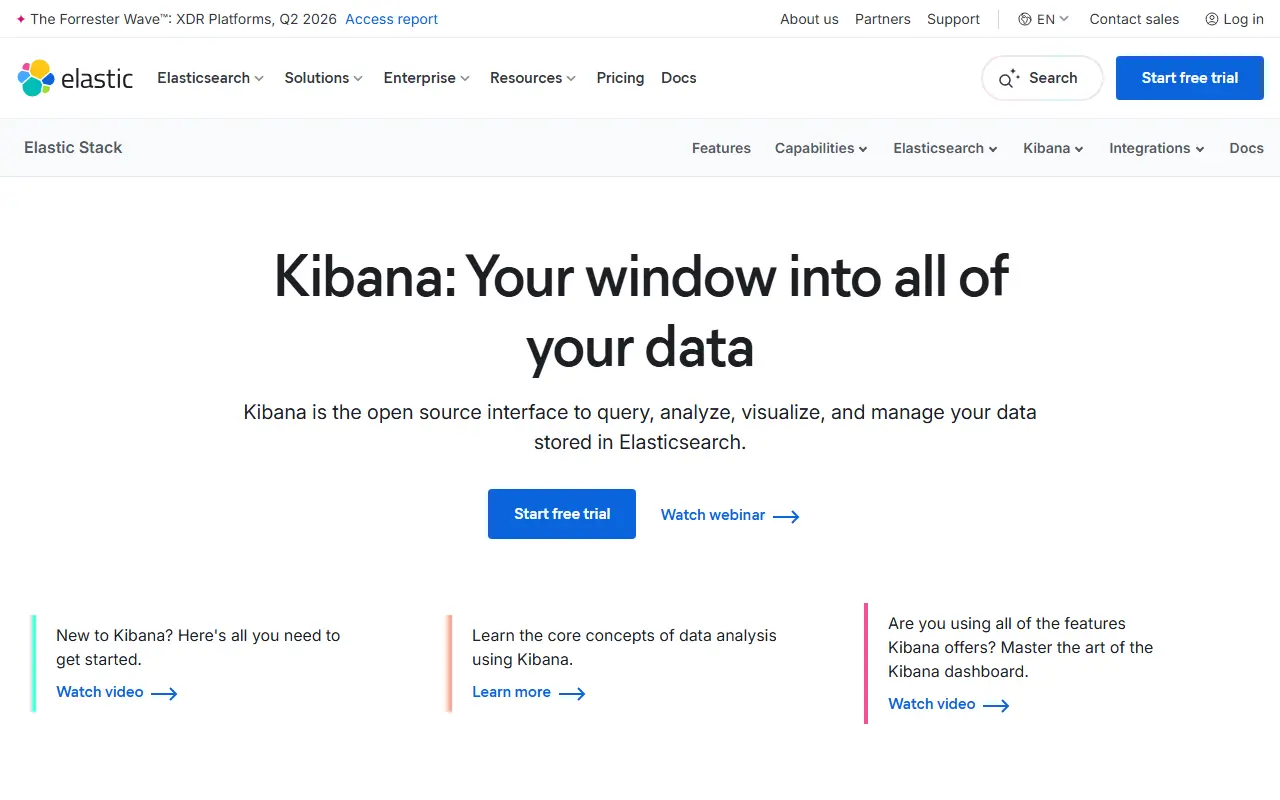
elastic.coKibana homepage screenshot

Kibana is the user interface that sits on top of Elasticsearch. It lets people query, analyze, visualize and manage the data stored there, turning indexes into charts, metrics views and dashboards. It is part of the Elastic Stack and is commonly used for log analysis, observability and general analytics work.

Teams build visualizations and assemble them into shared dashboards, explore documents with search, and use the interface to manage parts of an Elasticsearch deployment. The project advises running Kibana and Elasticsearch at the same version, with major versions required to match, because mismatches can cause problems and support may ask for an upgrade first.

The code is written in TypeScript. The repository lists its license as 'Other' rather than a standard SPDX identifier, so the license files should be read for the exact terms. Kibana can be downloaded and run on your own infrastructure, and Elastic also offers a hosted version through its Cloud service.

Key features

  • Query and explore Elasticsearch data
  • Visualizations and metrics charts
  • Shared dashboards for monitoring
  • Observability views for logs and metrics
  • Management tools for Elasticsearch data
  • Hosted option through Elastic Cloud
Read more about KibanaWebsite GitHub

Quickwit

A cloud-native open-source search engine for observability data, built in Rust to index logs and traces on object storage with an Elasticsearch-compatible API.

GitHub stars
12k
Last commit
today
Latest release
v0.9.1
Licence
Apache-2.0
Self-hosted
Yes
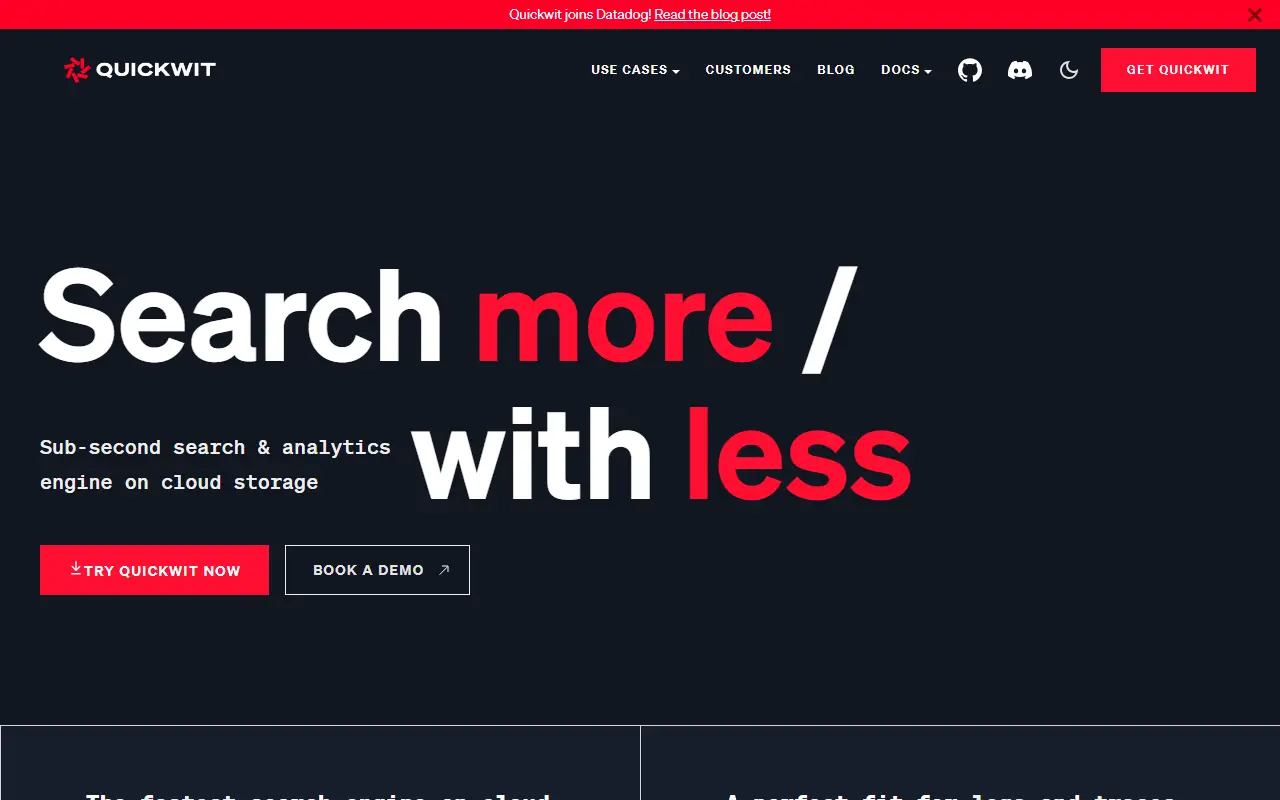
quickwit.ioQuickwit homepage screenshot

Quickwit is an open-source, cloud-native search engine designed for observability, covering log management and distributed tracing, with metrics support listed on the roadmap. It is written in Rust, builds on the Tantivy search library, and is meant to search large volumes of data kept in cheap object storage.

It provides full-text search and aggregation queries, schemaless or strict-schema indexing, and a RESTful API that is compatible with a large subset of the Elasticsearch and OpenSearch APIs, so existing clients can often be reused. It is native to Jaeger and OpenTelemetry, works as a Grafana data source and can ingest from Kafka, Kinesis and Pulsar. Compute and storage are decoupled, with stateless indexers and searchers, and data can sit on Amazon S3, Azure Blob Storage or Google Cloud Storage.

Operational features include multi-tenancy with many indexes, partitioning, retention policies and delete tasks for GDPR use cases, and a Helm chart for Kubernetes. Quickwit is licensed under Apache-2.0 and you run it yourself. It suits teams looking for lower-cost log and trace storage with a familiar search API.

Key features

  • Full-text search and aggregation queries
  • API compatible with Elasticsearch clients
  • Native Jaeger and OpenTelemetry support
  • Search directly on cloud object storage
  • Decoupled compute and storage
  • Ingestion from Kafka, Kinesis and Pulsar
  • Retention policies and GDPR delete tasks
  • Helm chart for Kubernetes

Pricing: Free and open source under the Apache-2.0 licence.

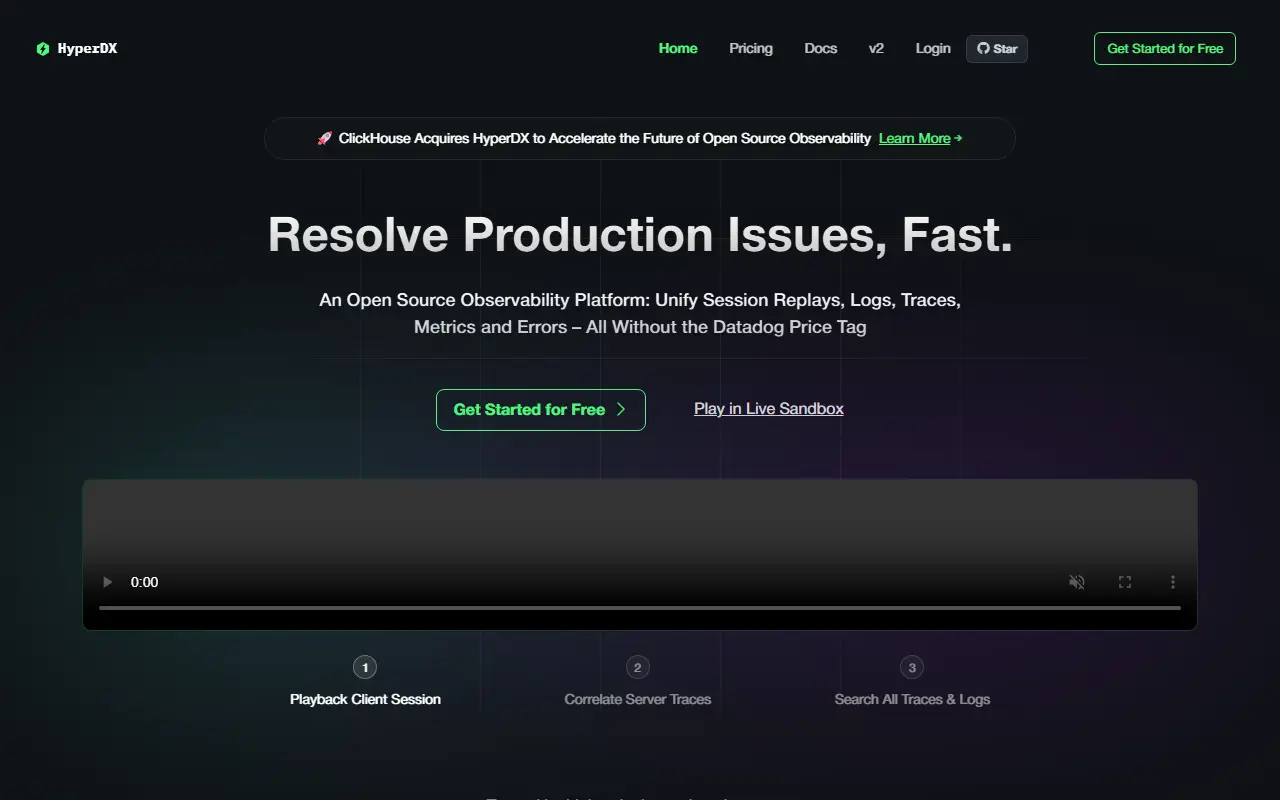
HyperDX

An open-source observability platform that unifies logs, traces, metrics and session replays on top of ClickHouse and OpenTelemetry, a Kibana-style experience for ClickHouse.

GitHub stars
9.9k
Last commit
today
Latest release
cli-v0.6.4
Licence
MIT
Self-hosted
Yes
Hosted version
Available
hyperdx.ioHyperDX homepage screenshot

HyperDX is an open-source observability platform for working out why production is broken. It brings logs, metrics, traces, errors and session replays into one place, and works as a search and visualization layer on top of ClickHouse and OpenTelemetry, which the authors compare to Kibana for ClickHouse. It is a core component of ClickStack.

It is schema agnostic and can sit on top of an existing ClickHouse schema. Searching uses full-text and property syntax such as level:err, with SQL as an option, events can be compared with event deltas, high-cardinality events can be charted on dashboards, and alerts can be set up in a few clicks. Live tail shows the newest logs and traces, JSON strings can be queried natively, OpenTelemetry works out of the box, and APM views cover HTTP requests down to database queries.

One deployment option is ClickStack, a bundle of ClickHouse, HyperDX, an OpenTelemetry Collector and MongoDB, and HyperDX can instead be pointed at your own ClickHouse instance. It can also be used with ClickHouse Cloud. The project is MIT licensed and written in TypeScript.

Key features

  • Unified logs, metrics, traces and session replays
  • Schema-agnostic search on ClickHouse
  • Full-text and property search syntax
  • Alerts and event delta analysis
  • Live tail for logs and traces
  • OpenTelemetry support out of the box
  • Dashboards for high-cardinality events

Pricing: Free plan stores up to 3 GB a month. Starter is $20 per month flat with 50 GB included and $0.40 per extra GB; Enterprise is custom. No per-seat or per-host billing.

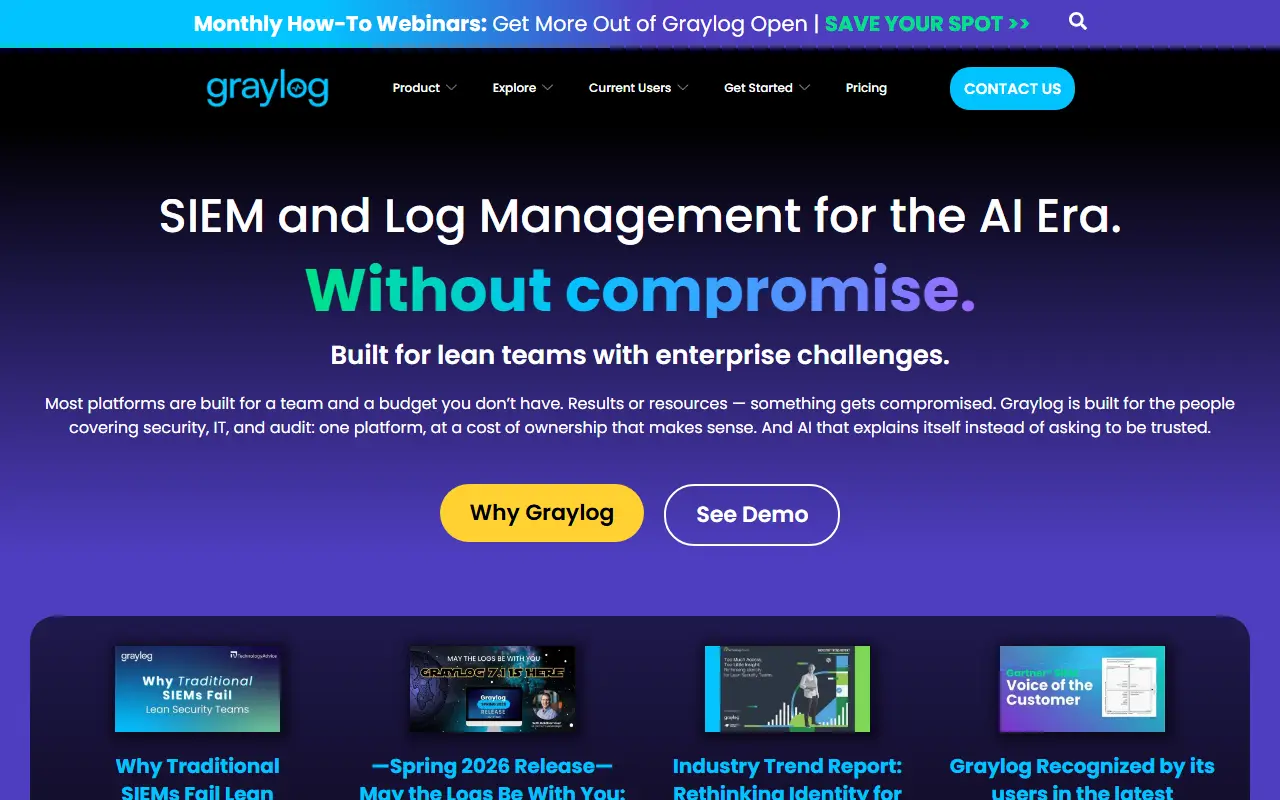
Graylog

Graylog is a free, open log management platform written in Java that collects, searches and analyzes logs, with a focus on security use cases.

GitHub stars
8.2k
Last commit
today
Self-hosted
Yes
graylog.orgGraylog homepage screenshot

Graylog is a log management server written in Java and described by its maintainers as free and open. It centralizes log data from many systems so teams can search, view and analyze events in one place instead of connecting to each machine individually.

The repository topics point to support for common log formats and transports, including GELF and syslog, along with Kafka and AMQP inputs. Topics also place the project in log analysis, log collection, secure logging and SIEM territory, which reflects its use for monitoring and security work. Specific features were not available when this entry was written, because the vendor website could not be read.

Key features

  • Centralized log collection and search
  • GELF and syslog input formats
  • Kafka and AMQP integration
  • Log analysis and viewing
  • Security-oriented logging

Security Onion

Security Onion is a free Linux platform for threat hunting, network and host security monitoring and log management, with a unified web console.

GitHub stars
4.9k
Last commit
today
Latest release
3.3.0-20260911
Self-hosted
Yes
securityonion.netSecurity Onion homepage screenshot

Security Onion is a no-cost, open Linux distribution built for threat hunting, security monitoring across an enterprise, and log management. It bundles a suite of tools designed to work together so defenders get visibility into both network and host activity from a single platform.

The Security Onion Console is a unified web interface for analyzing events and managing the deployment, with its own tools for alerting, dashboards, hunting, packet capture, detections and case management. Underneath it uses the Elastic Stack for search, Suricata for network intrusion detection, Elastic Fleet for host monitoring, Zeek for network metadata and other tools such as osquery and CyberChef. The installer and configuration are largely shell scripts.

The repository license appears as 'Other' on GitHub. Security Onion is deployed on your own hardware or virtual machines, either standalone or as a distributed grid. It suits security operations centers, incident responders and blue teams that want an integrated, open alternative to commercial monitoring platforms.

Key features

  • Unified Security Onion Console web interface
  • Network intrusion detection with Suricata
  • Network metadata from Zeek
  • Elastic Stack search and dashboards
  • Case management and threat hunting
  • Packet capture and detections

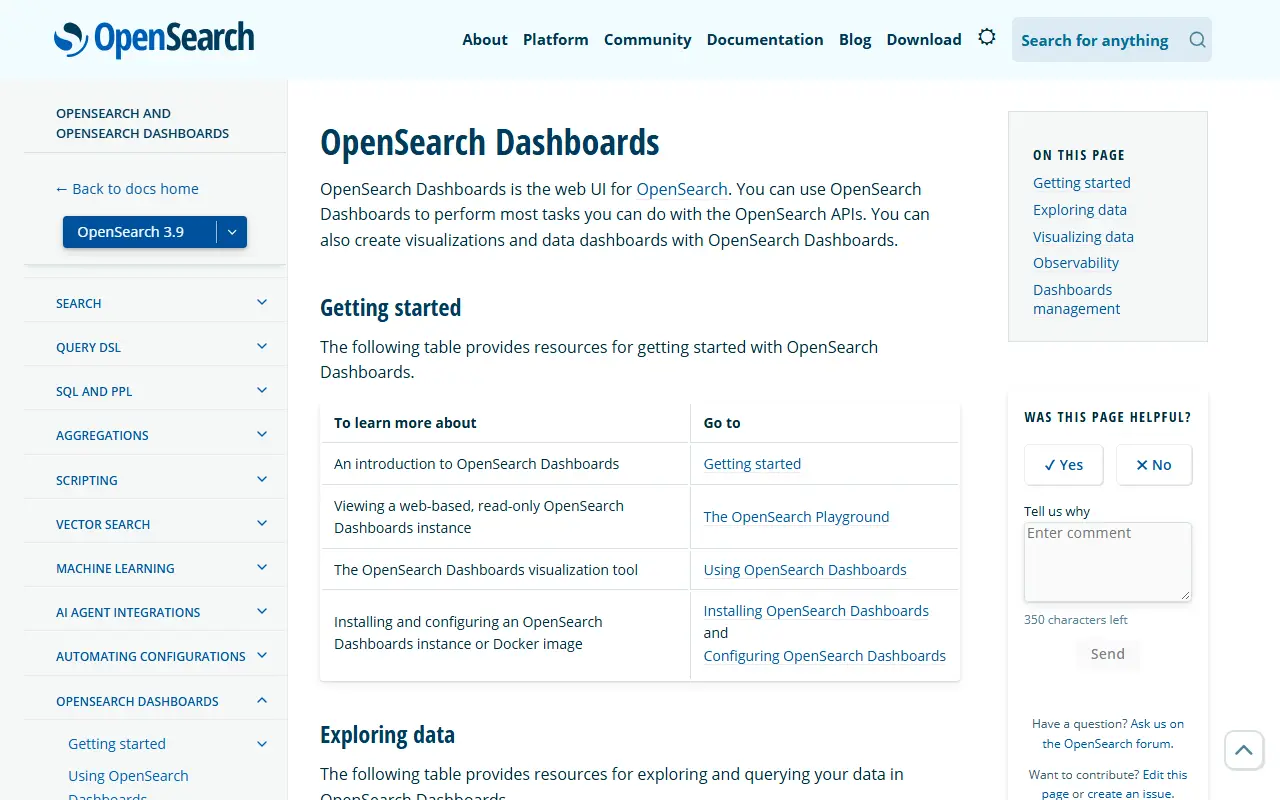
OpenSearch Dashboards

Open-source visualization and exploration interface for OpenSearch, used to build dashboards and analyze indexed data.

GitHub stars
2.1k
Last commit
yesterday
Latest release
3.8.0
Licence
Apache-2.0
Self-hosted
Yes
opensearch.orgOpenSearch Dashboards homepage screenshot

OpenSearch Dashboards is the data visualization tool that accompanies OpenSearch. It provides charts, dashboards, and exploration features that help turn indexed data into business intelligence and support data-driven decisions and planning. It is written in TypeScript and released under the Apache-2.0 license.

The project is community-driven and welcomes contributions through issues, feedback, ideas, and code, and the README points to resources for setting up a development environment, the code of conduct, and licensing information. It began as a fork of Kibana, which is why it follows a similar model of visualization over a search and analytics engine.

Dashboards is used together with an OpenSearch cluster and is self-hosted or run through managed services from cloud vendors. It suits operations, security, and analytics teams that already store logs, metrics, and documents in OpenSearch and need a way to search, visualize, and share insights.

Key features

  • Data visualization for OpenSearch
  • Dashboards and charts
  • Data exploration interface
  • Business intelligence support
  • Community-driven open-source development
  • Plugin-friendly architecture

Pricing: Free and open source under the Apache-2.0 license.

ClickVisual

A lightweight browser-based log analytics and search platform built on ClickHouse, with query dashboards, alarms and Kubernetes-friendly deployment.

GitHub stars
1.6k
Last commit
8 days ago
Latest release
v1.1.2
Licence
MIT
Self-hosted
Yes
clickvisual.netClickVisual homepage screenshot

ClickVisual is a lightweight, browser-based platform for log analysis and search, built on top of the ClickHouse database. It was created by the team at ShimoDocs and positions itself as a simpler tool for working with logs stored in ClickHouse, in the space where people often reach for Kibana and the ELK stack.

The interface offers a visual query dashboard with a histogram and raw log view, SQL-based querying, and percentage breakdowns for chosen fields. A VS Code style configuration board lets you push Fluent Bit configuration to a Kubernetes ConfigMap. It includes alarm workflows, and the documentation mentions login through GitHub and GitLab.

ClickVisual is written in Go and released under the MIT licence. It can be deployed with kubectl, which the project describes as out of the box, or installed with Docker or directly on a host, and documentation is published on its website. It suits platform and SRE teams that already collect logs into ClickHouse and want a straightforward UI for searching them without heavy infrastructure.

Key features

  • Visual log query dashboard with histogram
  • SQL queries over raw logs
  • Field value percentage breakdowns
  • Fluent Bit config editor for Kubernetes
  • Alarm workflows for log events
  • GitHub and GitLab authentication

Pricing: Free and open source under the MIT licence.

Sumo Logic alternatives: questions

What is the best open-source alternative to Sumo Logic?
SigNoz is the top-ranked open-source alternative to Sumo Logic on Enlisted: An open-source observability platform built on OpenTelemetry that unifies APM, logs, metrics, traces, alerts and dashboards in one tool, self-hosted or in the cloud. Other strong options are Grafana Loki, OpenObserve, Kibana and Quickwit.
Are these Sumo Logic alternatives free?
All 10 are open source, so the code is free to use under its licence, and all of them can be self-hosted on your own server or computer. 5 also offer a paid or managed cloud version if you'd rather not host it yourself.
How is this list of Sumo Logic alternatives ranked?
By a score built from GitHub stars, star growth over the last 30 days and how recently the code changed. 10 of these projects shipped code in the last 30 days. Data is refreshed daily, and nobody can pay to move up.

People also look for alternatives to…

View all