7,363 open-source and SaaS tools, with GitHub stats refreshed every day.

7 alternatives ranked by real activity

Open-source LiveSession alternatives

A curated, ranked list of the 7 best open-source alternatives to LiveSession.

The best open-source alternative to LiveSession is Sentry. If that doesn't suit you, other good options are PostHog, OpenReplay, HyperDX and Highlight.io.

LiveSession alternatives are mainly monitoring & observability tools, but some are also analytics tools and session replay tools. 7 of them shipped code in the last 30 days, 7 can be self-hosted, and 3 use a permissive licence.

Last updated October 2, 2026 · ranked by GitHub stars, growth and recent commits

Sentry

A developer-focused platform for error tracking and performance monitoring that helps teams detect, trace and fix issues, with SDKs for most programming languages.

GitHub stars
45k
Last commit
today
Latest release
26.9.0
Self-hosted
Yes
Hosted version
Available
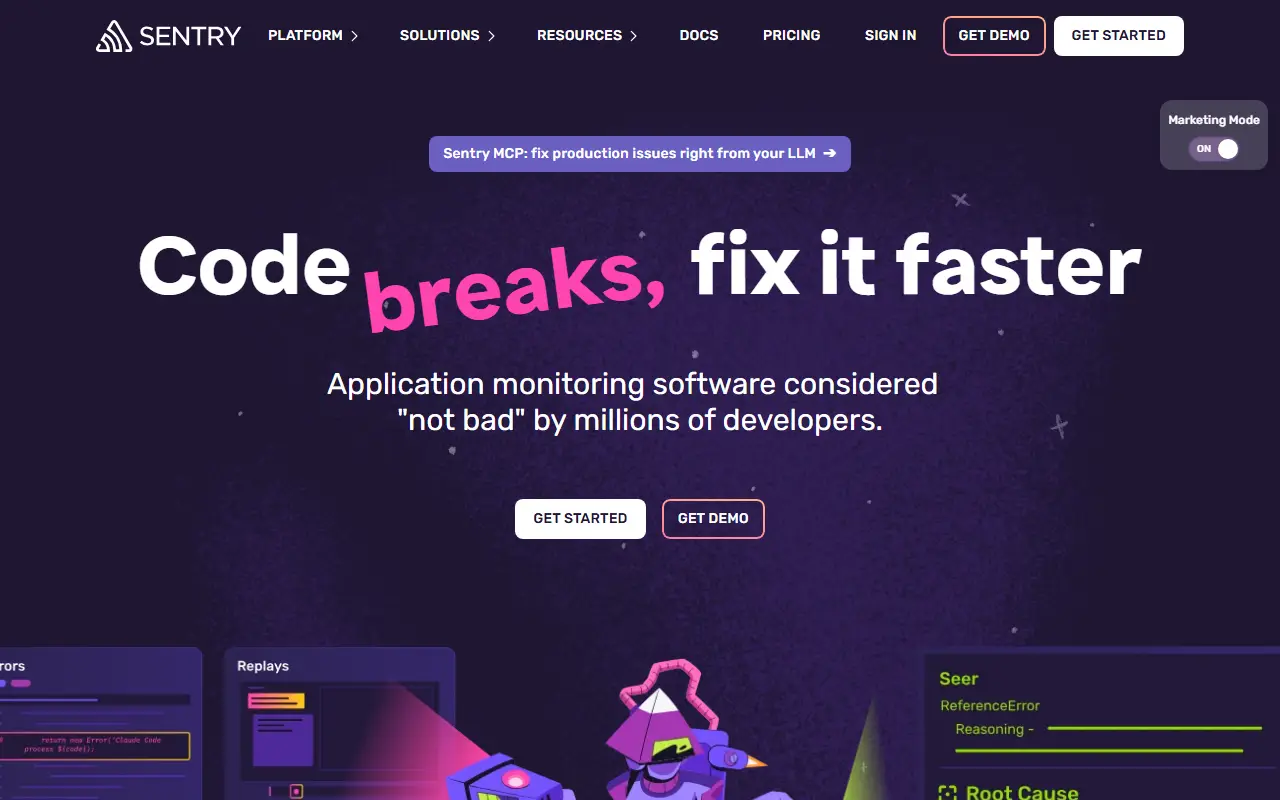
sentry.ioSentry homepage screenshot

Sentry is a debugging platform that helps developers detect, trace and fix problems in their applications. It collects crash reports and errors from running software, groups them into issues, and adds the context needed to understand what happened, alongside performance monitoring for slow requests and transactions.

Integration happens through official SDKs covering web, mobile, desktop, server and game platforms, from JavaScript, Python and PHP to Go, Rust, Java, Kotlin, Swift, Flutter, Unity, Unreal Engine and Godot. The server itself is a Python application built on Django, and topics also mention CSP report collection and application performance monitoring.

Sentry is source available, and its license is listed as 'Other' on GitHub rather than a standard open-source license. It can be run on your own infrastructure, and the company also operates the hosted service at sentry.io. It is used by engineering teams of all sizes as a first stop when something breaks in production.

Key features

  • Error and crash tracking
  • Application performance monitoring
  • Official SDKs for many languages and frameworks
  • Issue grouping with debugging context
  • CSP report collection
  • Self-hosted or hosted deployment

Pricing: Free Developer plan for one user. Team is $26 per month and Business $80 per month when billed annually, with unlimited users; Enterprise is custom. Usage above the included quota is billed pay-as-you-go.

Read more about SentryWebsite GitHub

PostHog

An open-source product platform combining analytics, session replay, feature flags, experiments, surveys and error tracking, with AI that turns signals into reports.

GitHub stars
40k
Last commit
today
Latest release
desktop-v0.61.621
Self-hosted
Yes
Hosted version
Available
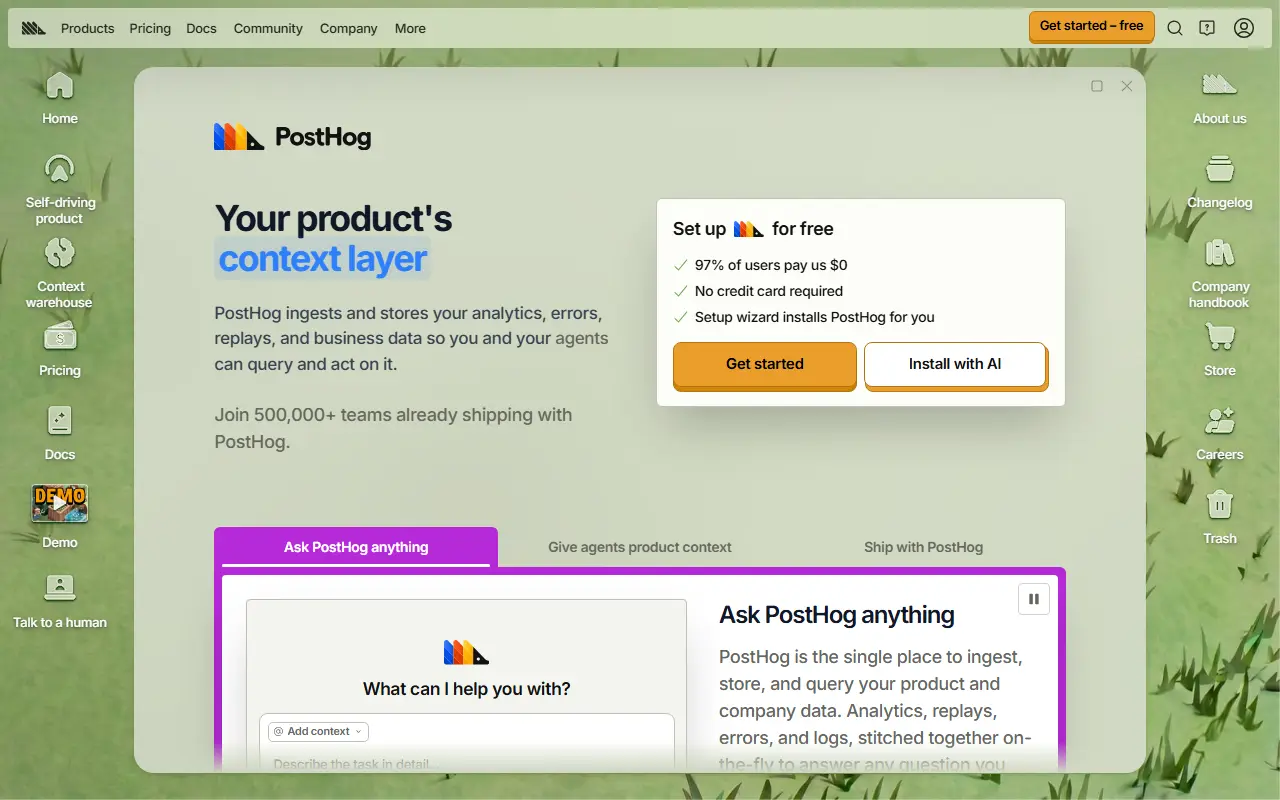
posthog.comPostHog homepage screenshot

PostHog is an open-source platform that bundles the tools product teams use to understand and improve what they ship. It captures event data, user sessions and errors in one place, and its newer self-driving mode aims to turn signals such as errors, rage clicks and failed queries into researched reports and pull requests that engineers review and merge.

The product suite includes product analytics with autocapture or manual instrumentation and SQL analysis, web analytics with a dashboard resembling Google Analytics, session replays for web and mobile, feature flags, experiments with statistical measurement, surveys, error tracking, logs, a data warehouse and a customer data platform. The back end is Python and the front end is React and TypeScript.

PostHog's repository license is listed as 'Other' on GitHub, so check which parts are open source and which are enterprise-only. It can be self-hosted, and the company also runs a managed cloud service. It suits product and engineering teams that prefer a single tool over separate analytics, flagging and replay vendors.

Key features

  • Product analytics with autocapture and SQL
  • Web analytics dashboard
  • Session replay for web and mobile
  • Feature flags and experiments
  • Surveys and error tracking
  • Data warehouse and customer data platform
  • AI-assisted detection of product issues

Pricing: Every product has a free monthly tier with no credit card needed. Pay-as-you-go charges only for usage beyond the free limits; per-unit rates are not shown here and volume discounts are available.

Read more about PostHogWebsite GitHub

OpenReplay

A self-hosted session replay, cobrowsing and product analytics platform that keeps user session data inside your own infrastructure.

GitHub stars
13k
Last commit
today
Latest release
v1.28.0
Self-hosted
Yes
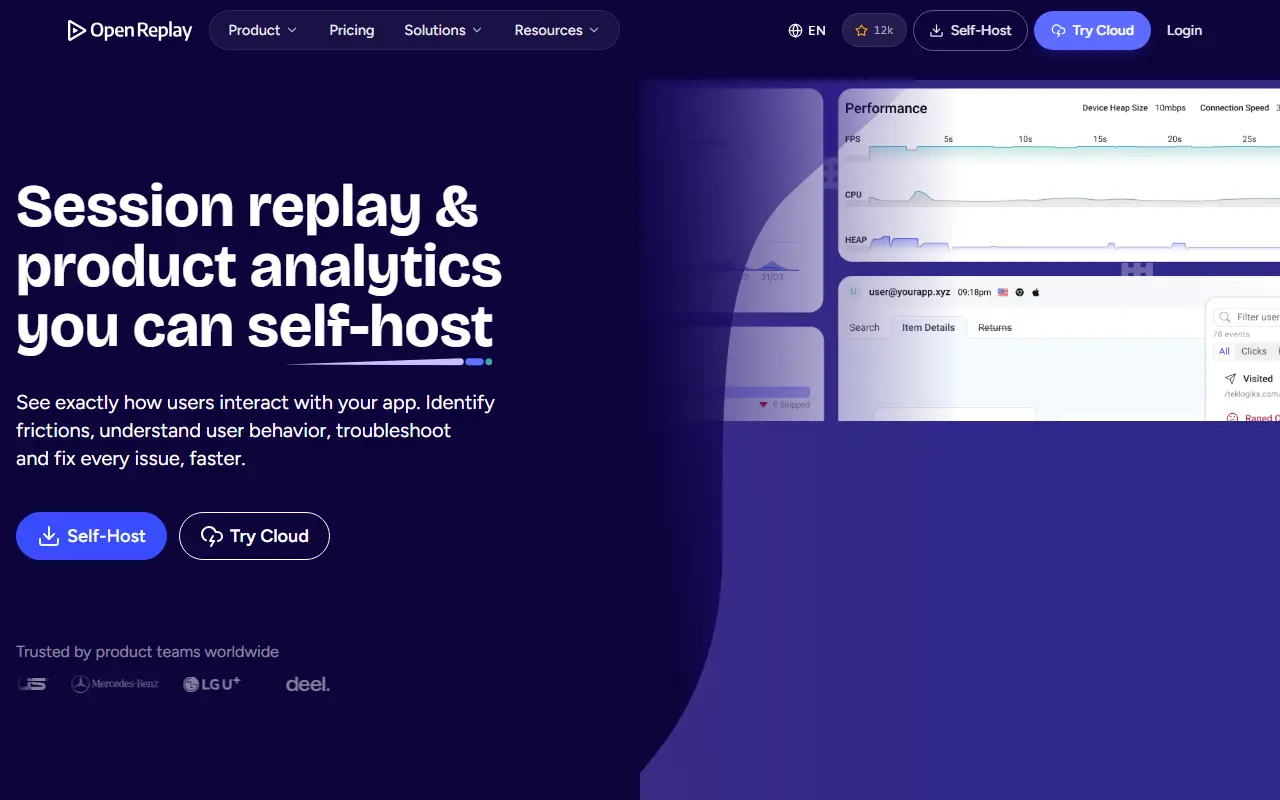
openreplay.comOpenReplay homepage screenshot

OpenReplay is an open-source experience platform that you host on your own infrastructure. It combines session replay, DevTools-level debugging context, product analytics and live cobrowsing, so teams can see how real users navigate, where they struggle and what errors they hit without sending sessions to a third party.

Because everything stays in your own cloud, it is pitched at teams that cannot hand customer data to an external vendor. Data can be masked, obscured or skipped at capture time before it reaches your servers, and a private mode redacts everything by default. A lightweight tracker sends data asynchronously to limit the impact on page performance, and SDKs cover frameworks such as React, Angular, Vue, Svelte, Next.js and React Native.

The README states it can be self-hosted for free on AWS, GCP, Azure and other platforms. The repository lists its licence as Other and its topics also reference feature flags, web vitals and real-user monitoring, so it spans debugging, product and support use cases.

Key features

  • Session replay with search and filtering
  • DevTools context for debugging sessions
  • Product analytics for usage insights
  • Live cobrowsing with users
  • Masking and private mode at capture time
  • Lightweight asynchronous tracker
  • Web and mobile framework SDKs

Pricing: Self-hosting is free. Managed Dedicated instances start from $199 a month (billed hourly) with a 7-day trial; Serverless is usage-based and Enterprise is custom.

HyperDX

An open-source observability platform that unifies logs, traces, metrics and session replays on top of ClickHouse and OpenTelemetry, a Kibana-style experience for ClickHouse.

GitHub stars
9.9k
Last commit
yesterday
Latest release
cli-v0.6.4
Licence
MIT
Self-hosted
Yes
Hosted version
Available
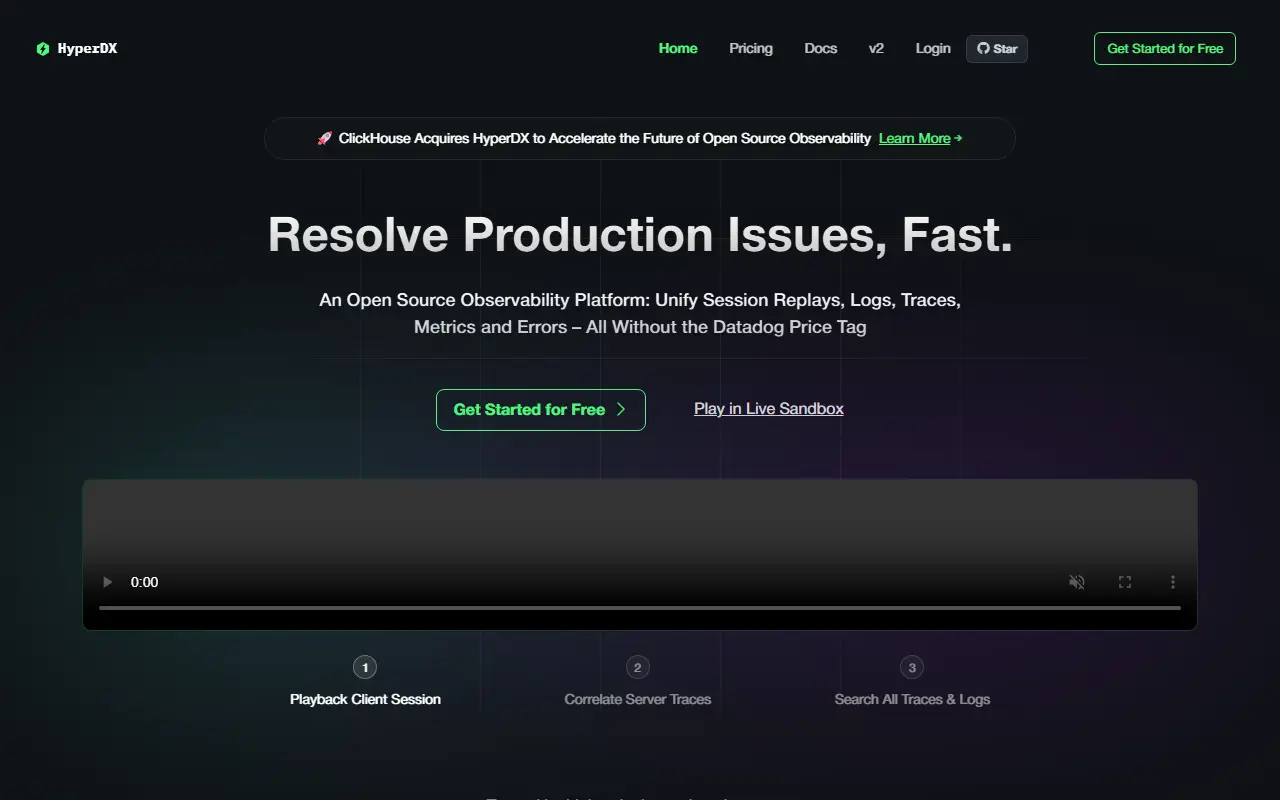
hyperdx.ioHyperDX homepage screenshot

HyperDX is an open-source observability platform for working out why production is broken. It brings logs, metrics, traces, errors and session replays into one place, and works as a search and visualization layer on top of ClickHouse and OpenTelemetry, which the authors compare to Kibana for ClickHouse. It is a core component of ClickStack.

It is schema agnostic and can sit on top of an existing ClickHouse schema. Searching uses full-text and property syntax such as level:err, with SQL as an option, events can be compared with event deltas, high-cardinality events can be charted on dashboards, and alerts can be set up in a few clicks. Live tail shows the newest logs and traces, JSON strings can be queried natively, OpenTelemetry works out of the box, and APM views cover HTTP requests down to database queries.

One deployment option is ClickStack, a bundle of ClickHouse, HyperDX, an OpenTelemetry Collector and MongoDB, and HyperDX can instead be pointed at your own ClickHouse instance. It can also be used with ClickHouse Cloud. The project is MIT licensed and written in TypeScript.

Key features

  • Unified logs, metrics, traces and session replays
  • Schema-agnostic search on ClickHouse
  • Full-text and property search syntax
  • Alerts and event delta analysis
  • Live tail for logs and traces
  • OpenTelemetry support out of the box
  • Dashboards for high-cardinality events

Pricing: Free plan stores up to 3 GB a month. Starter is $20 per month flat with 50 GB included and $0.40 per extra GB; Enterprise is custom. No per-seat or per-host billing.

Read more about HyperDXWebsite GitHub

Highlight.io

An open-source full-stack monitoring platform that combines session replay, error monitoring, logging and distributed tracing, offered hosted or self-hosted.

GitHub stars
9.4k
Last commit
yesterday
Latest release
docker-v0.5.6
Self-hosted
Yes
Hosted version
Available
app.highlight.ioHighlight.io homepage screenshot

Highlight, at highlight.io, is an open-source monitoring platform for developers. Its aim is to give teams one cohesive tool covering the front end and back end, instead of separate products for errors, logs and user sessions.

The core features are session replay, error monitoring and logging, with tracing and metrics also in scope. Console logs from the front end can be analyzed, and errors are embedded alongside the session in which they happened, so you can see what the user was doing beforehand. Session comments let teams discuss user frustration or bugs, there are integrations with other tools, and client SDKs install with a few lines of code.

You can sign up for the free-to-start hosted version at app.highlight.io, or deploy a hobby instance on Linux with Docker, sized at roughly 8 GB of memory, four CPUs and 64 GB of storage. The code is written in TypeScript and Go, and the repository lists the license as Other, so check the licence file for terms.

Key features

  • Session replay for user interactions
  • Error monitoring tied to sessions
  • Logging and console log analysis
  • Distributed tracing and metrics
  • Session comments for team discussion
  • Client SDKs for several platforms
  • Docker hobby self-hosting

Pricing: A hosted version is free to start; a hobby self-hosted instance is available. The repository lists the license as Other.

Webfunny

Webfunny is a front-end monitoring, back-end APM and user behavior tracking system with a free community edition for private deployment.

GitHub stars
5.3k
Last commit
8 days ago
Latest release
3.1.60
Licence
Apache-2.0
Self-hosted
Yes
webfunny.comWebfunny homepage screenshot

Webfunny combines front-end monitoring, back-end application performance monitoring and business event tracking in one system. The monitoring side is aimed at technical teams who want to find and fix production problems, while the tracking side serves business teams who analyze user behavior.

According to its README, a short probe snippet collects errors, performance data and user behavior without changing business code. Features include real-time traffic dashboards with page views and unique visitors, user lookup by ID with behavior replay, and automatic grouping of code errors. Deployment needs only Node.js and supports one-click Docker installation, and a cluster edition is described for very high traffic. The documentation is largely in Chinese.

Webfunny is released under Apache-2.0 and offers a free community edition for private deployment, plus a paid enterprise edition with source code available for purchase and customization. It suits companies, especially Chinese-speaking ones, that want to keep monitoring data on their own servers.

Key features

  • Front-end error and performance monitoring
  • Back-end APM monitoring
  • User behavior tracking and replay
  • Real-time traffic dashboards
  • Lightweight probe with no code changes
  • One-click Docker private deployment

Pricing: A free community edition exists for private deployment; a paid enterprise edition is also offered, with details on the vendor's site.

Read more about WebfunnyWebsite GitHub

Traceway

An OpenTelemetry-native observability platform combining logs, traces, metrics, exceptions, session replay and AI tracing, self-hosted or in the cloud.

GitHub stars
1.6k
Last commit
3 days ago
Latest release
cli/v2.0.3
Licence
MIT
Self-hosted
Yes
Hosted version
Available
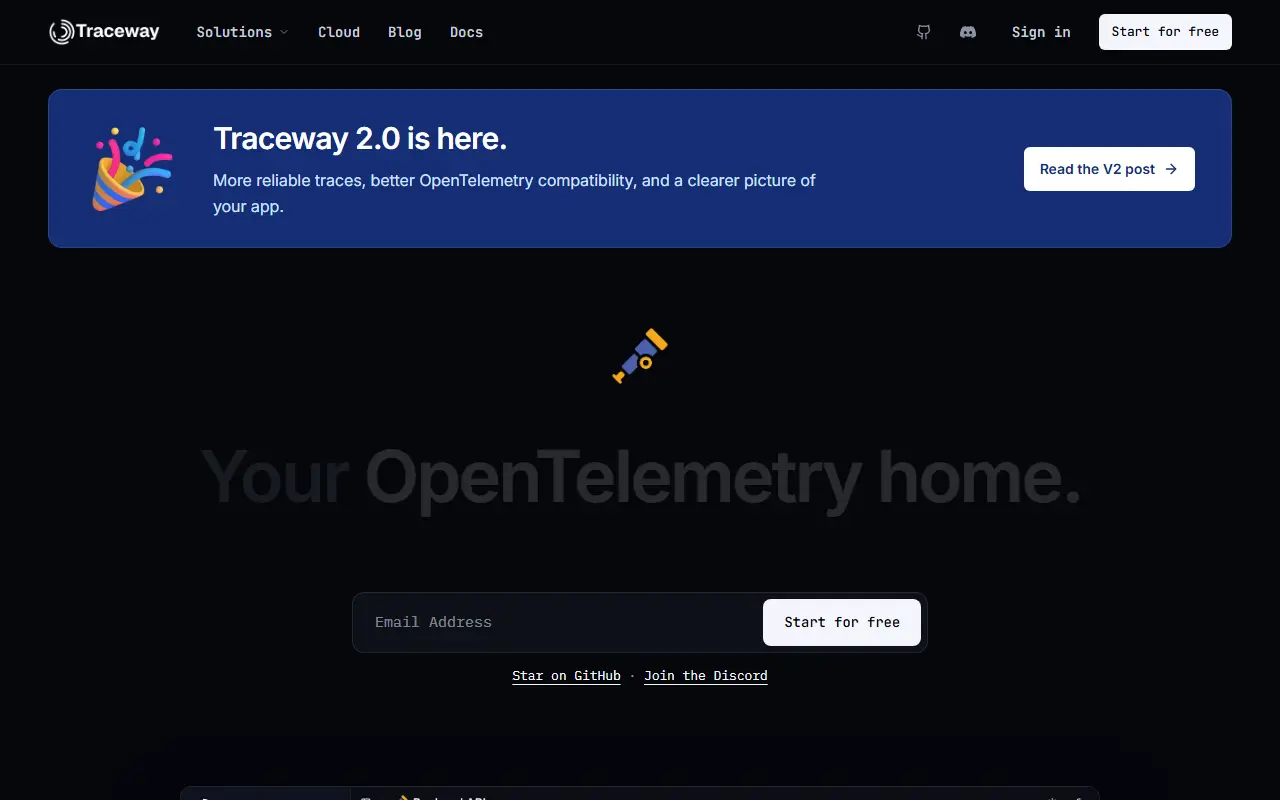
tracewayapp.comTraceway homepage screenshot

Traceway is an observability platform built natively on OpenTelemetry. It brings logs, traces, metrics, exception tracking, session replay, AI tracing and on-call paging into one product, and you can start by pointing an OTLP exporter at it without a separate collector or a vendor-specific SDK for each language.

Logs are structured and linked to traces, so you can jump from a log line to its span. Traces show end-to-end waterfalls, endpoint views rank routes by latency percentiles and error rate, and exceptions are grouped into ranked issues with source map support. There is experimental profiling with flame graphs, session replay for web and Flutter apps, and LLM observability covering cost, tokens and latency.

The project is written in Go, licensed under MIT and says that every feature ships in the open-source build with no open-core split. You can self-host it for free, using a setup the README says takes about 90 seconds, or run it on Traceway Cloud if you prefer not to manage infrastructure. It suits engineering teams looking for one tool to find and diagnose production problems.

Key features

  • Structured logs linked to traces
  • End-to-end distributed tracing waterfalls
  • Grouped exception tracking with source maps
  • Session replay for web and Flutter
  • LLM cost and latency observability
  • On-call paging and alerting

Pricing: Free to self-host under the MIT licence with all features included; a hosted Traceway Cloud option is also available.

Read more about TracewayWebsite GitHub

LiveSession alternatives: questions

What is the best open-source alternative to LiveSession?
Sentry is the top-ranked open-source alternative to LiveSession on Enlisted: A developer-focused platform for error tracking and performance monitoring that helps teams detect, trace and fix issues, with SDKs for most programming languages. Other strong options are PostHog, OpenReplay, HyperDX and Highlight.io.
Are these LiveSession alternatives free?
All 7 are open source, so the code is free to use under its licence, and all of them can be self-hosted on your own server or computer. 5 also offer a paid or managed cloud version if you'd rather not host it yourself.
How is this list of LiveSession alternatives ranked?
By a score built from GitHub stars, star growth over the last 30 days and how recently the code changed. 7 of these projects shipped code in the last 30 days. Data is refreshed daily, and nobody can pay to move up.

People also look for alternatives to…

View all