6,598 open-source and SaaS tools, with GitHub stats refreshed every day.

9 alternatives ranked by real activity

Open-source Sentry alternatives

A curated, ranked list of the 9 best open-source alternatives to Sentry.

The best open-source alternative to Sentry is HyperDX. If that doesn't suit you, other good options are Sentry, Highlight.io, OneUptime and Webfunny.

Sentry alternatives are mainly Monitoring & Observability tools, but some are also Hosting & PaaS. 9 of them shipped code in the last 30 days, 9 can be self-hosted, and 6 use a permissive licence.

Last updated October 2, 2026 · ranked by GitHub stars, growth and recent commits

HyperDX

An open-source observability platform that unifies logs, traces, metrics and session replays on top of ClickHouse and OpenTelemetry, a Kibana-style experience for ClickHouse.

GitHub stars
9.9k
Last commit
today
Latest release
cli-v0.6.4
Licence
MIT
Self-hosted
Yes
Hosted version
Available
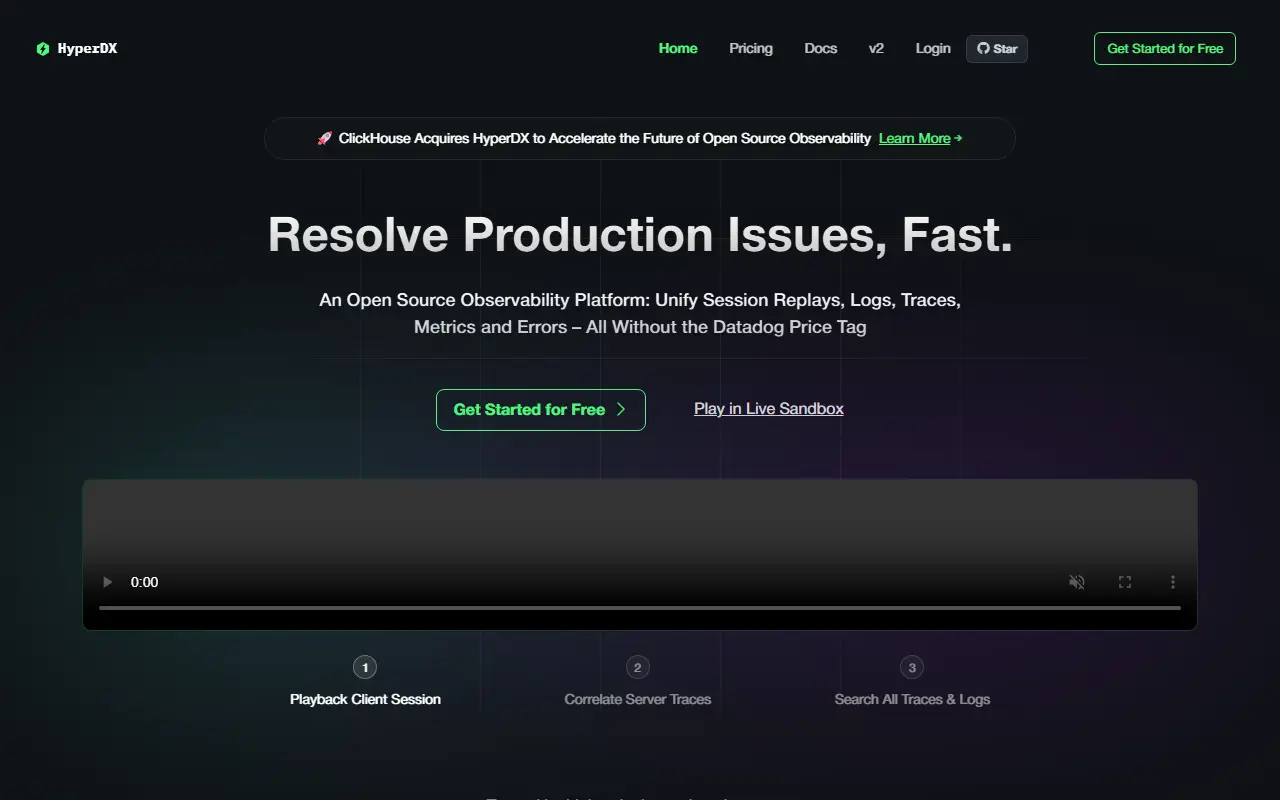
hyperdx.ioHyperDX homepage screenshot

HyperDX is an open-source observability platform for working out why production is broken. It brings logs, metrics, traces, errors and session replays into one place, and works as a search and visualization layer on top of ClickHouse and OpenTelemetry, which the authors compare to Kibana for ClickHouse. It is a core component of ClickStack.

It is schema agnostic and can sit on top of an existing ClickHouse schema. Searching uses full-text and property syntax such as level:err, with SQL as an option, events can be compared with event deltas, high-cardinality events can be charted on dashboards, and alerts can be set up in a few clicks. Live tail shows the newest logs and traces, JSON strings can be queried natively, OpenTelemetry works out of the box, and APM views cover HTTP requests down to database queries.

One deployment option is ClickStack, a bundle of ClickHouse, HyperDX, an OpenTelemetry Collector and MongoDB, and HyperDX can instead be pointed at your own ClickHouse instance. It can also be used with ClickHouse Cloud. The project is MIT licensed and written in TypeScript.

Key features

  • Unified logs, metrics, traces and session replays
  • Schema-agnostic search on ClickHouse
  • Full-text and property search syntax
  • Alerts and event delta analysis
  • Live tail for logs and traces
  • OpenTelemetry support out of the box
  • Dashboards for high-cardinality events

Pricing: Free plan stores up to 3 GB a month. Starter is $20 per month flat with 50 GB included and $0.40 per extra GB; Enterprise is custom. No per-seat or per-host billing.

Sentry

Self-hosted Sentry packaged with Docker Compose, for running the error and performance monitoring platform on your own server.

GitHub stars
9.6k
Last commit
today
Latest release
26.9.0
Self-hosted
Yes
Hosted version
Available
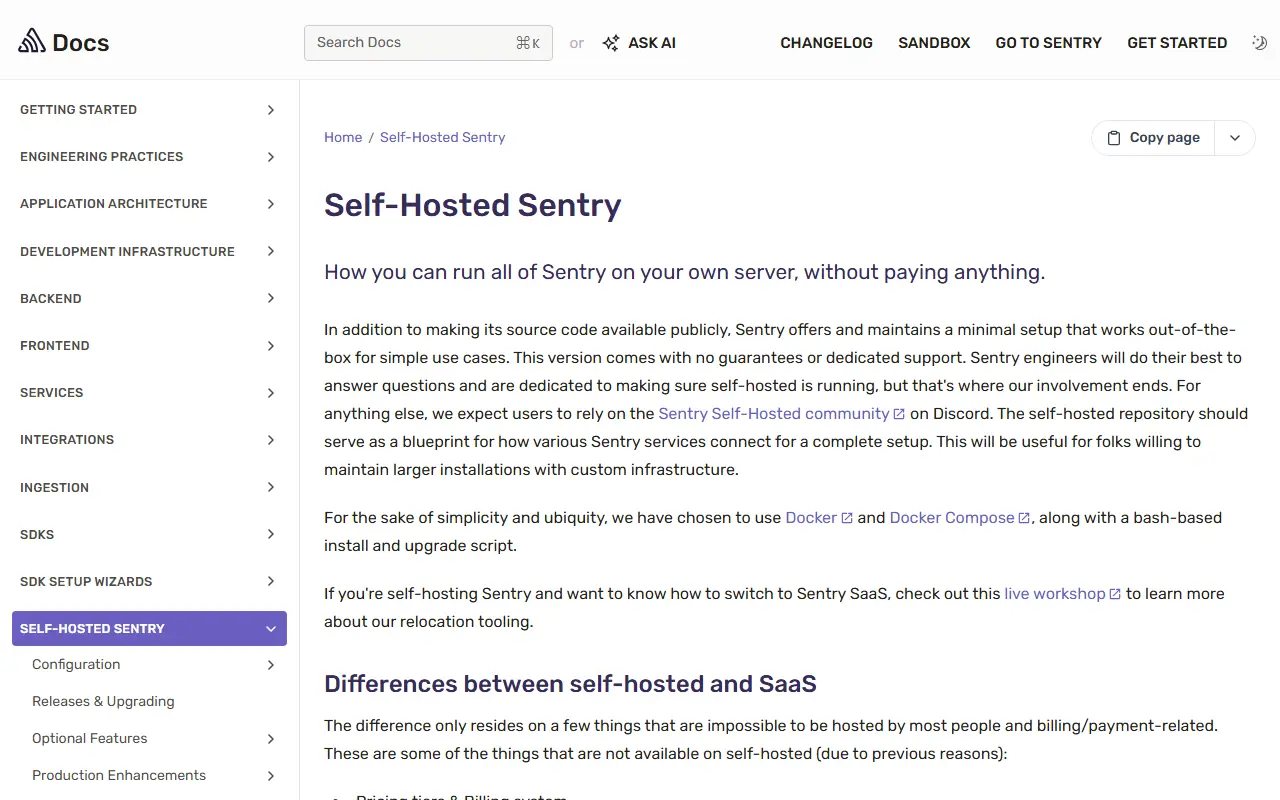
develop.sentry.devSentry homepage screenshot

This repository packages Sentry for self-hosting. It lets organizations run the whole Sentry platform on their own server without paying for the hosted product, and the project describes it as feature-complete but aimed at low-volume deployments and proofs of concept. The entry is listed under the name Develop, taken from the documentation site.

Sentry maintains a minimal setup that works out of the box for simple cases, built on Docker and Docker Compose with a bash-based install and upgrade script. It comes with no guarantees or dedicated support, so users are expected to rely on the community on Discord. For larger installations the repository acts as a blueprint of how Sentry services connect, and the docs cover configuration, upgrades, backup and restore, and production enhancements.

The code is distributed under Sentry's fair-source license rather than a standard open-source one. Documentation also explains the small number of differences between self-hosted and the SaaS version, along with relocation tooling for moving to Sentry's hosted service.

Key features

  • Complete Sentry stack for self-hosting
  • Docker Compose based installation
  • Install and upgrade scripts
  • Backup and restore documentation
  • Reference architectures for larger installs

Pricing: Free to self-host under Sentry's fair-source license with no guaranteed support; a hosted SaaS version is also available.

Highlight.io

An open-source full-stack monitoring platform that combines session replay, error monitoring, logging and distributed tracing, offered hosted or self-hosted.

GitHub stars
9.4k
Last commit
yesterday
Latest release
docker-v0.5.6
Self-hosted
Yes
Hosted version
Available
app.highlight.ioHighlight.io homepage screenshot

Highlight, at highlight.io, is an open-source monitoring platform for developers. Its aim is to give teams one cohesive tool covering the front end and back end, instead of separate products for errors, logs and user sessions.

The core features are session replay, error monitoring and logging, with tracing and metrics also in scope. Console logs from the front end can be analyzed, and errors are embedded alongside the session in which they happened, so you can see what the user was doing beforehand. Session comments let teams discuss user frustration or bugs, there are integrations with other tools, and client SDKs install with a few lines of code.

You can sign up for the free-to-start hosted version at app.highlight.io, or deploy a hobby instance on Linux with Docker, sized at roughly 8 GB of memory, four CPUs and 64 GB of storage. The code is written in TypeScript and Go, and the repository lists the license as Other, so check the licence file for terms.

Key features

  • Session replay for user interactions
  • Error monitoring tied to sessions
  • Logging and console log analysis
  • Distributed tracing and metrics
  • Session comments for team discussion
  • Client SDKs for several platforms
  • Docker hobby self-hosting

Pricing: A hosted version is free to start; a hobby self-hosted instance is available. The repository lists the license as Other.

OneUptime

An open-source platform that combines uptime monitoring, status pages, on-call, incident management, logs, traces, metrics and error tracking in one self-hostable app.

GitHub stars
7.7k
Last commit
today
Latest release
14.0.11
Self-hosted
Yes
Hosted version
Available
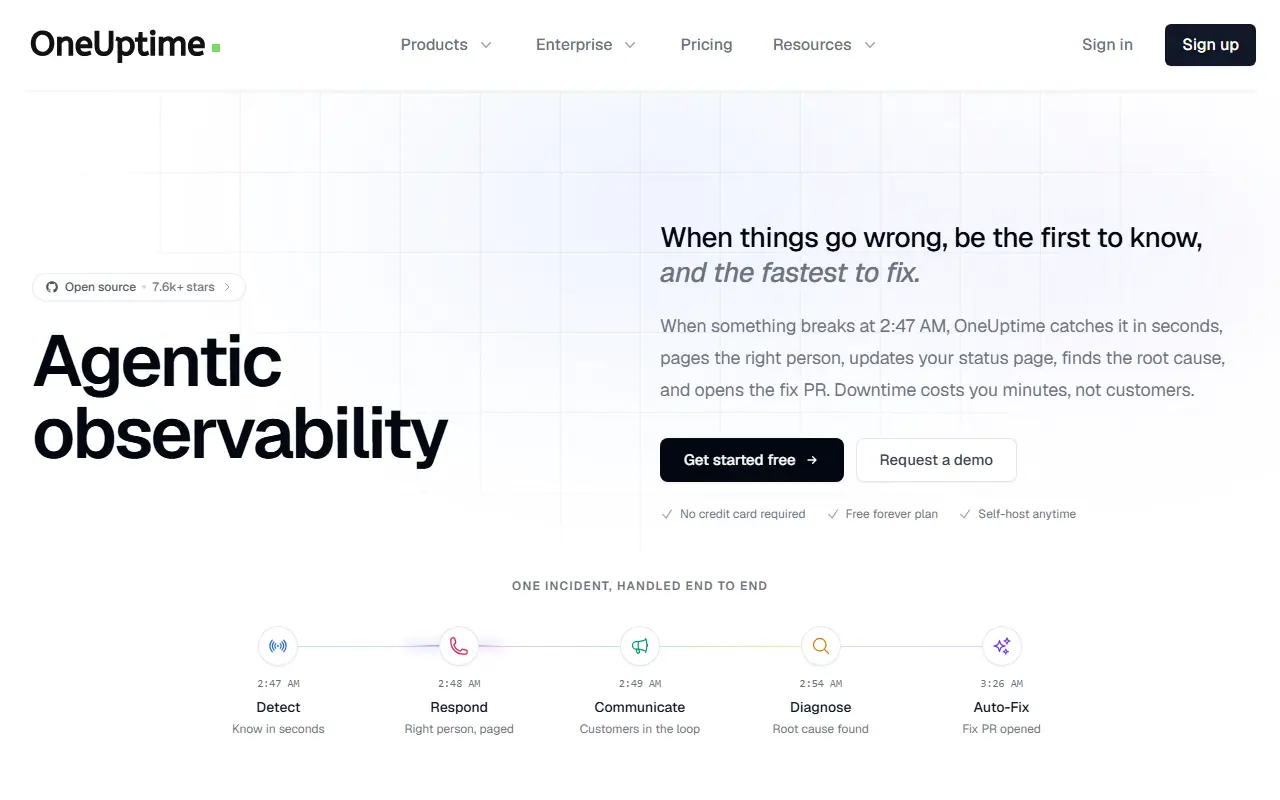
oneuptime.comOneUptime homepage screenshot

OneUptime is an open-source monitoring and observability platform that aims to replace a shelf of separate SaaS tools. It covers uptime monitoring, status pages, on-call and alerting, incident management, logs, traces, metrics, APM and error tracking in one application, and adds AI-assisted features such as helping find the root cause and proposing a fix.

Its README maps each module to the tools it can replace: Pingdom and UptimeRobot for uptime checks across websites, APIs, ports, SSL and DNS, StatusPage.io for branded public and private status pages, PagerDuty and Opsgenie for schedules, escalation policies and SMS, call, push or Slack alerts, Incident.io for declaring and triaging incidents with post-mortems, Datadog and New Relic for traces and dashboards, Loggly for logs, and Sentry for exceptions.

The Community Edition is open source under Apache 2.0 and free to self-host, and OneUptime Cloud offers a free-forever plan with no credit card. It is written in TypeScript. It suits small and mid-sized engineering teams that want one platform for reliability work rather than integrating many vendors.

Key features

  • Uptime monitoring for sites, APIs and ports
  • Branded public and private status pages
  • On-call schedules and escalation policies
  • Incident management with post-mortems
  • Logs, traces, metrics and APM
  • Error tracking with stack traces

Pricing: Free plan with one status page. Growth is $22 and Scale $99 per month with 14-day trials; Enterprise is custom. Monitors, SMS, telemetry and AI use are billed on top.

Webfunny

Webfunny is a front-end monitoring, back-end APM and user behavior tracking system with a free community edition for private deployment.

GitHub stars
5.3k
Last commit
8 days ago
Latest release
3.1.60
Licence
Apache-2.0
Self-hosted
Yes
webfunny.comWebfunny homepage screenshot

Webfunny combines front-end monitoring, back-end application performance monitoring and business event tracking in one system. The monitoring side is aimed at technical teams who want to find and fix production problems, while the tracking side serves business teams who analyze user behavior.

According to its README, a short probe snippet collects errors, performance data and user behavior without changing business code. Features include real-time traffic dashboards with page views and unique visitors, user lookup by ID with behavior replay, and automatic grouping of code errors. Deployment needs only Node.js and supports one-click Docker installation, and a cluster edition is described for very high traffic. The documentation is largely in Chinese.

Webfunny is released under Apache-2.0 and offers a free community edition for private deployment, plus a paid enterprise edition with source code available for purchase and customization. It suits companies, especially Chinese-speaking ones, that want to keep monitoring data on their own servers.

Key features

  • Front-end error and performance monitoring
  • Back-end APM monitoring
  • User behavior tracking and replay
  • Real-time traffic dashboards
  • Lightweight probe with no code changes
  • One-click Docker private deployment

Pricing: A free community edition exists for private deployment; a paid enterprise edition is also offered, with details on the vendor's site.

Exceptionless

Real-time error and event reporting for JavaScript, Node, and .NET applications, available as a hosted service or self-hosted with Docker.

GitHub stars
2.5k
Last commit
today
Latest release
v8.10.0
Licence
Apache-2.0
Self-hosted
Yes
Hosted version
Available
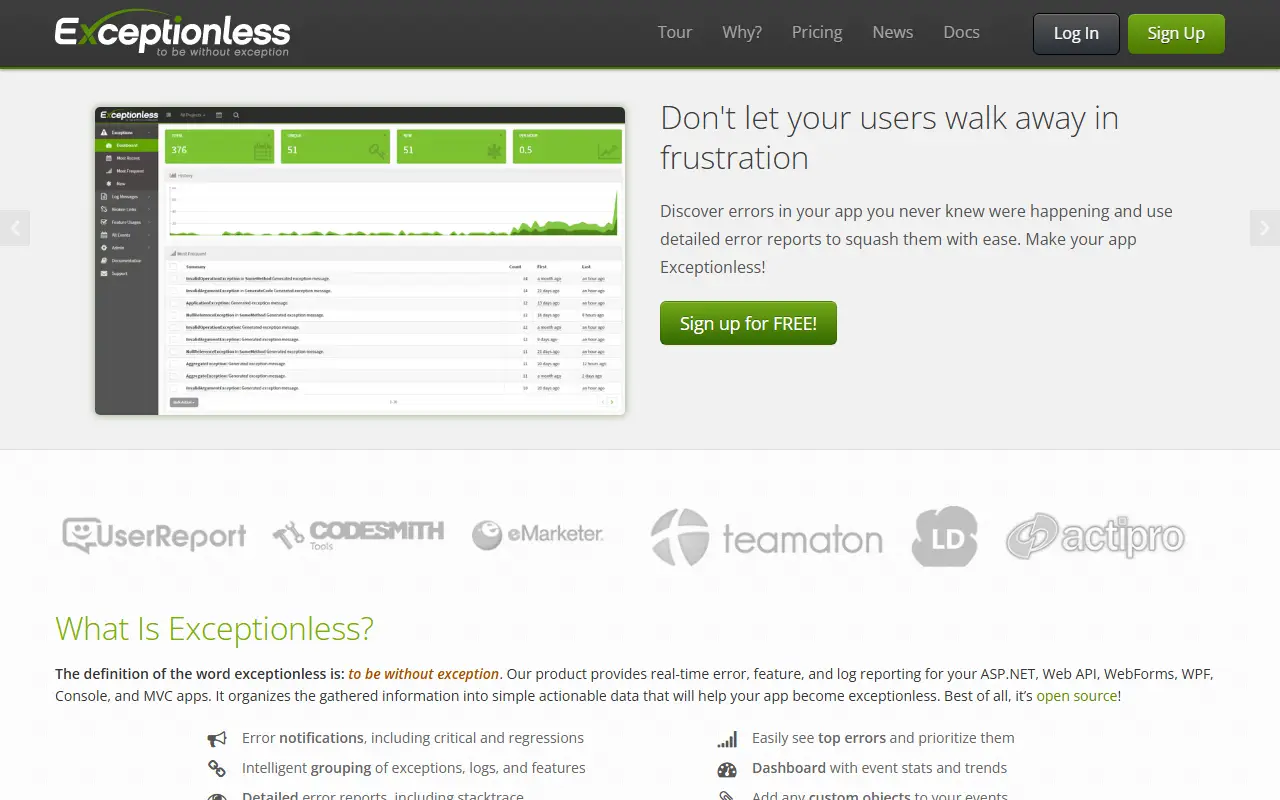
exceptionless.comExceptionless homepage screenshot

Exceptionless provides real-time error reporting for JavaScript, Node, .NET Core, ASP.NET, Web API, WebForms, WPF, console, and MVC applications. It gathers exceptions and logs, groups them into simple actionable data, and helps teams fix problems quickly. The name means without exception. It is released under the Apache-2.0 license.

The topics mention error monitoring, crash reporting, logging, bug tracking, Elasticsearch, Redis, and the Foundatio library, which indicate the stack behind the server. The application is written in C# with a JavaScript front end.

You can use the hosted service run by the project, which the maintainers describe as reasonably priced and as a way to support the project, along with setup and support services, or run the server yourself. A single Docker command starts a local instance on port 7110. It suits development teams who want an open-source alternative to commercial error-tracking tools.

Key features

  • Real-time error and exception reporting
  • Support for JavaScript, Node, and .NET apps
  • Grouped, actionable error data
  • Event logging
  • Docker one-command local setup
  • Hosted service or self-hosting

Pricing: A free plan includes 3,000 events per month. Paid plans range from $15 (Small) to $499 (Enterprise) per month, mainly by event volume; self-hosting is also possible.

Traceway

An OpenTelemetry-native observability platform combining logs, traces, metrics, exceptions, session replay and AI tracing, self-hosted or in the cloud.

GitHub stars
1.6k
Last commit
2 days ago
Latest release
cli/v2.0.3
Licence
MIT
Self-hosted
Yes
Hosted version
Available
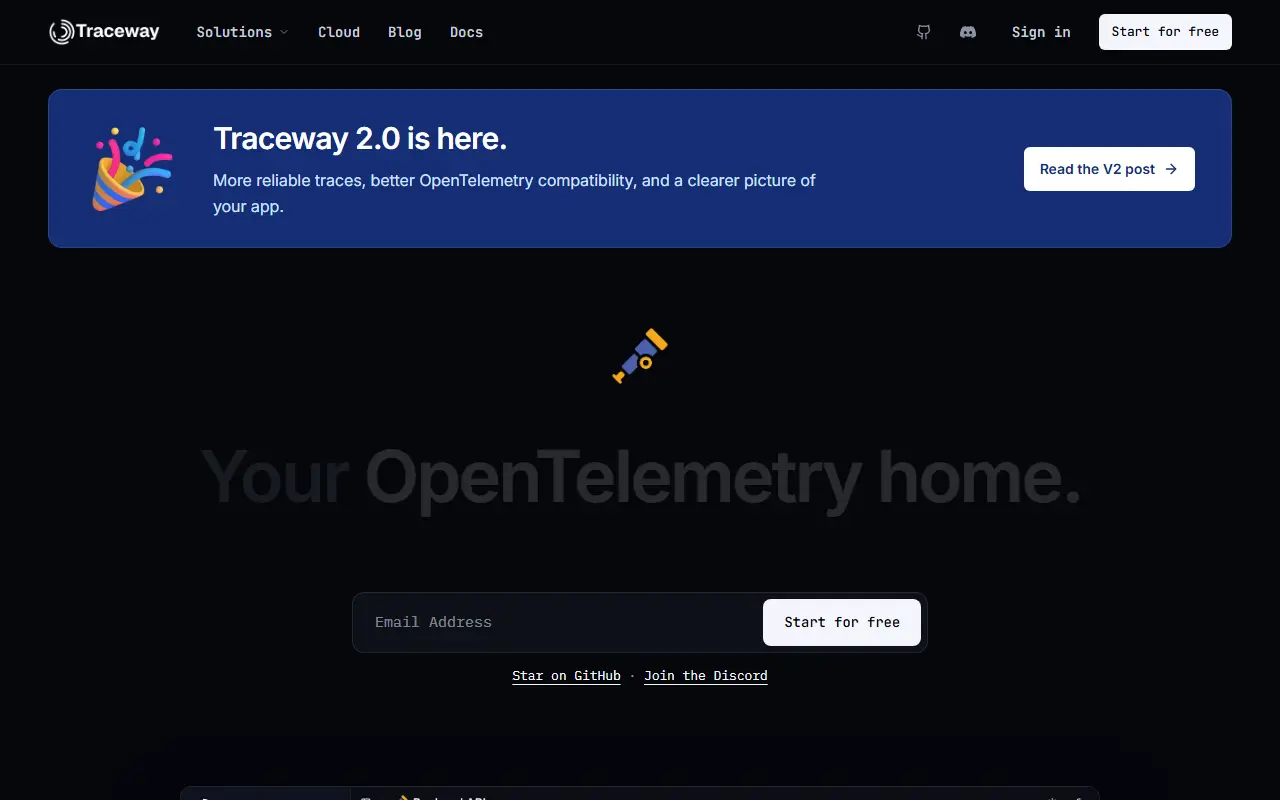
tracewayapp.comTraceway homepage screenshot

Traceway is an observability platform built natively on OpenTelemetry. It brings logs, traces, metrics, exception tracking, session replay, AI tracing and on-call paging into one product, and you can start by pointing an OTLP exporter at it without a separate collector or a vendor-specific SDK for each language.

Logs are structured and linked to traces, so you can jump from a log line to its span. Traces show end-to-end waterfalls, endpoint views rank routes by latency percentiles and error rate, and exceptions are grouped into ranked issues with source map support. There is experimental profiling with flame graphs, session replay for web and Flutter apps, and LLM observability covering cost, tokens and latency.

The project is written in Go, licensed under MIT and says that every feature ships in the open-source build with no open-core split. You can self-host it for free, using a setup the README says takes about 90 seconds, or run it on Traceway Cloud if you prefer not to manage infrastructure. It suits engineering teams looking for one tool to find and diagnose production problems.

Key features

  • Structured logs linked to traces
  • End-to-end distributed tracing waterfalls
  • Grouped exception tracking with source maps
  • Session replay for web and Flutter
  • LLM cost and latency observability
  • On-call paging and alerting

Pricing: Free to self-host under the MIT licence with all features included; a hosted Traceway Cloud option is also available.

Measure

A mobile app monitoring platform for crashes, ANRs, performance traces and session replays, positioned as an open-source alternative to Firebase Crashlytics.

GitHub stars
1.4k
Last commit
today
Latest release
measure_dio-v0.8.0
Licence
Apache-2.0
Self-hosted
Yes
Hosted version
Available
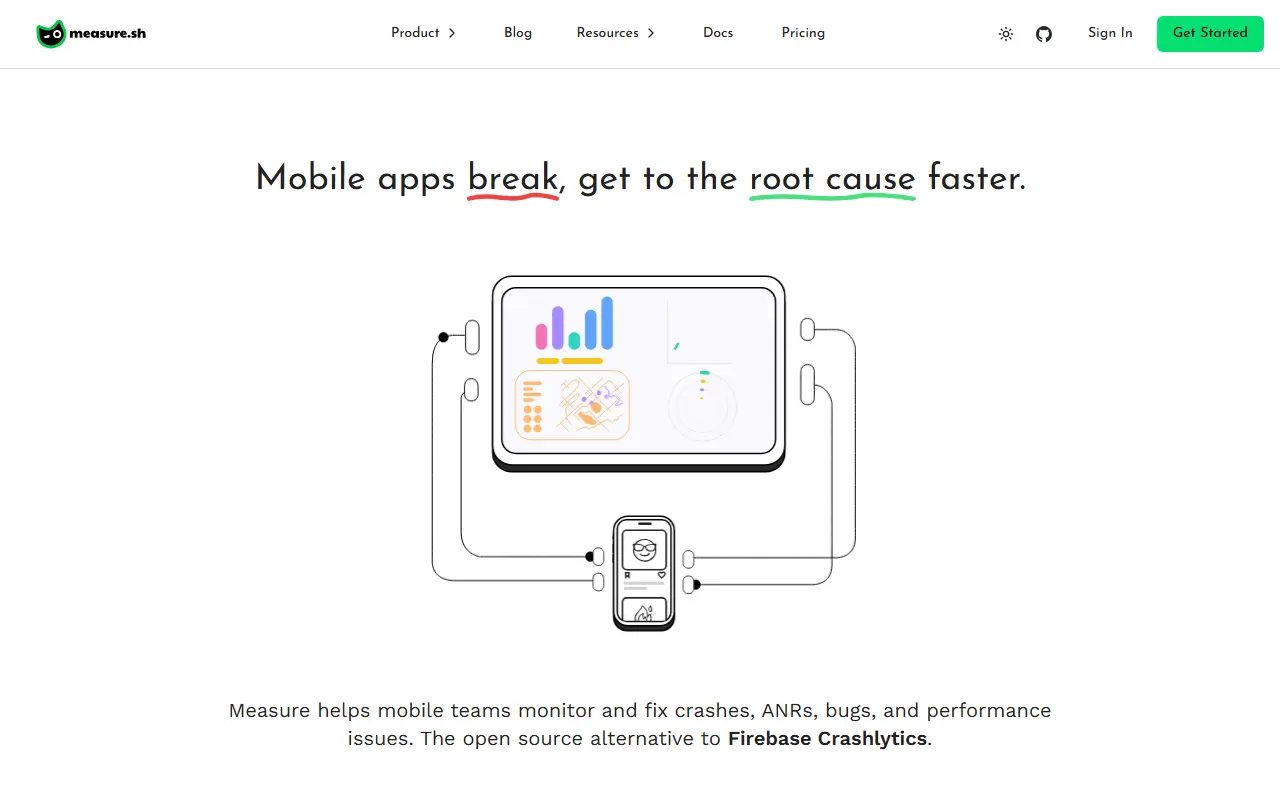
measure.shMeasure homepage screenshot

Measure helps mobile teams monitor and fix crashes, ANRs, bugs and performance problems in their apps. It is presented as an open-source alternative to Firebase Crashlytics, with SDKs for Android, iOS, Flutter and React Native so that teams can collect data from the platforms they ship on.

Features include session replays with automatic tracking of clicks, navigation and network calls, crash and ANR reports with screenshots and stack traces, performance traces and spans, bug reports triggered by a device shake, user journeys, network performance views and an app health dashboard. Adaptive capture lets you change data collection settings without releasing an app update, and a Measure Agent lets you investigate issues in natural language from Slack or a coding agent via MCP.

You can sign up to Measure Cloud or self-host it on your own servers. The project is licensed under Apache-2.0 and has a TypeScript codebase on the dashboard side, with Kotlin, Swift and Dart SDK components. It suits mobile development teams who want crash reporting and observability with the option to keep data on infrastructure they control.

Key features

  • Crash and ANR tracking with stack traces
  • Session replays of user actions
  • Performance traces and spans
  • Shake-to-report bug reports
  • Adaptive capture without app updates
  • SDKs for Android, iOS, Flutter, React Native

Pricing: A free plan includes 5 GB of data per month. Pro costs $50 per month with 25 GB included and $2.00 per extra GB; there are no seat limits.

Temps

Temps is a self-hosted Rust platform that bundles deployments, analytics, error tracking, uptime monitoring and an AI gateway in one binary.

GitHub stars
811
Last commit
today
Latest release
v0.0.8
Licence
Apache-2.0
Self-hosted
Yes
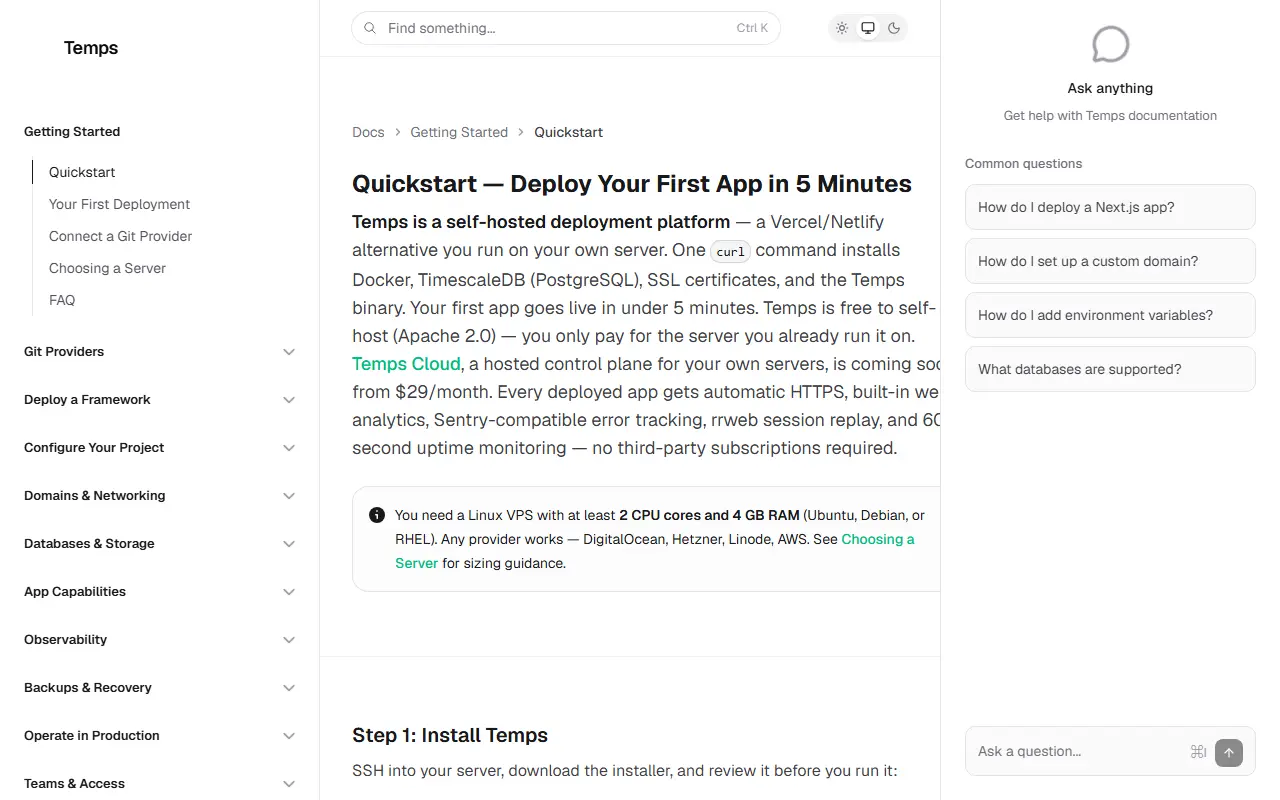
temps.shTemps homepage screenshot

Temps is an open-source, self-hosted platform written in Rust that aims to replace a stack of separate services. Its description positions it as an alternative to Vercel, Sentry, PostHog, Pingdom, Resend and E2B, covering deployments, web analytics, session replay, error tracking, OpenTelemetry, email, sandboxes and an AI gateway in a single binary.

It is built to be driven by AI agents as well as people. Every dashboard action is also a CLI command, with more than 440 operations in 69 groups, and the project ships skills for Claude Code, Codex and OpenCode so an agent can deploy, inspect traces or add a domain. An AI chat answers questions from your own telemetry, read-only by default, and an AI gateway exposes OpenAI, Anthropic, xAI and Google Gemini models through one OpenAI-compatible endpoint using your own keys.

Other built-in pieces include web analytics with funnels and rrweb session replay, uptime monitors with alerts for failed deploys and expiring certificates, and Sentry-compatible error tracking. Temps is licensed under Apache-2.0, and the latest tagged release is an early 0.0.x version, so expect rapid change.

Key features

  • Git-based deployments on your own servers
  • Web analytics with funnels and session replay
  • Sentry-compatible error tracking
  • Uptime monitoring with alerts
  • OpenAI-compatible AI gateway with your keys
  • 440+ CLI operations with agent skills

Pricing: Self-hosted Temps is free. Premium for self-hosted use is $399 per organisation per month; managed Cloud plans at $29 (Starter) and $99 (Team) per month are coming soon, with a 14-day trial.

Sentry alternatives: questions

What is the best open-source alternative to Sentry?
HyperDX is the top-ranked open-source alternative to Sentry on Enlisted: An open-source observability platform that unifies logs, traces, metrics and session replays on top of ClickHouse and OpenTelemetry, a Kibana-style experience for ClickHouse. Other strong options are Sentry, Highlight.io, OneUptime and Webfunny.
Are these Sentry alternatives free?
All 9 are open source, so the code is free to use under its licence, and 9 of them can be self-hosted on your own server. 7 also offer a paid or managed cloud version if you'd rather not host it yourself.
How is this list of Sentry alternatives ranked?
By a score built from GitHub stars, star growth over the last 30 days and how recently the code changed. 9 of these projects shipped code in the last 30 days. Data is refreshed daily, and nobody can pay to move up.

People also look for alternatives to…

View all