#1
An OpenTelemetry-native observability platform combining logs, traces, metrics, exceptions, session replay and AI tracing, self-hosted or in the cloud.
- GitHub stars
- 1.8k
- Last commit
- today
- Latest release
- cli/v2.0.11
- Licence
- MIT
- Self-hosted
- Yes
- Hosted version
- Available
tracewayapp.com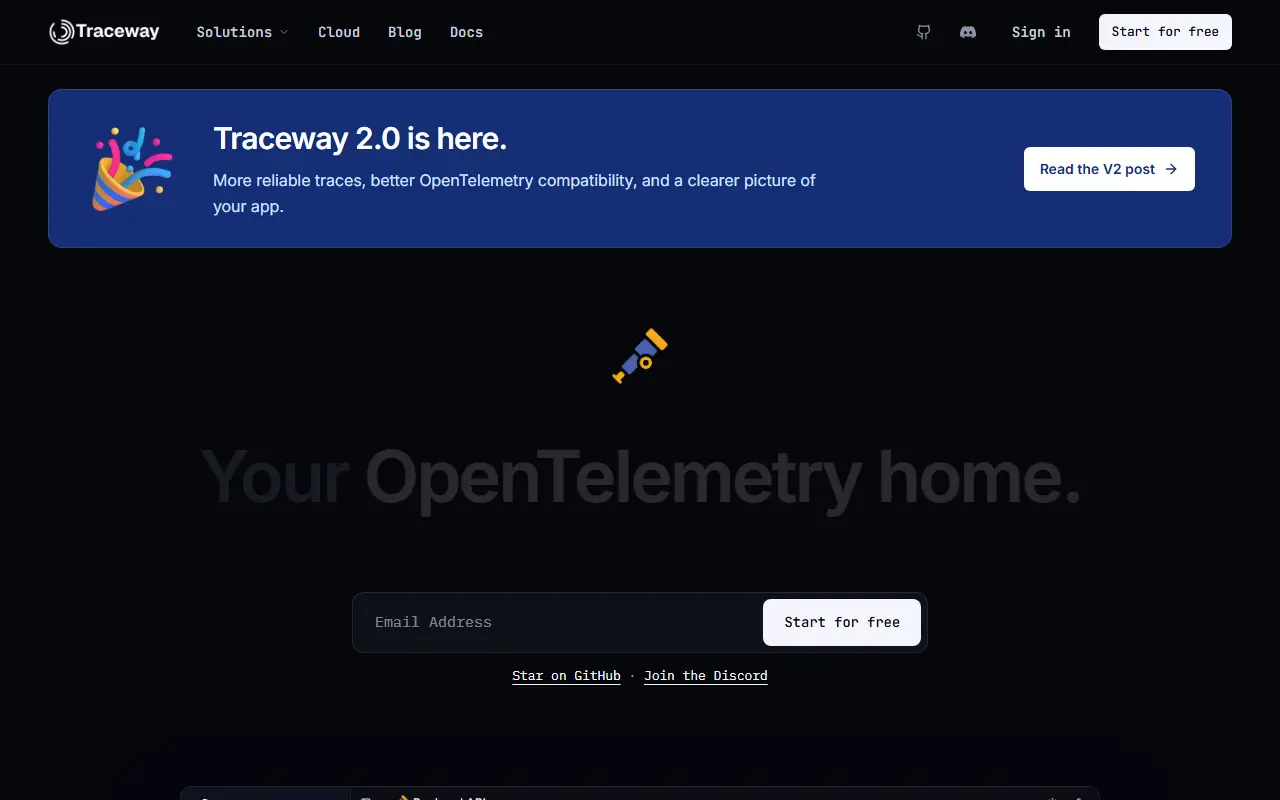
Traceway is an observability platform built natively on OpenTelemetry. It brings logs, traces, metrics, exception tracking, session replay, AI tracing and on-call paging into one product, and you can start by pointing an OTLP exporter at it without a separate collector or a vendor-specific SDK for each language.
Logs are structured and linked to traces, so you can jump from a log line to its span. Traces show end-to-end waterfalls, endpoint views rank routes by latency percentiles and error rate, and exceptions are grouped into ranked issues with source map support. There is experimental profiling with flame graphs, session replay for web and Flutter apps, and LLM observability covering cost, tokens and latency.
The project is written in Go, licensed under MIT and says that every feature ships in the open-source build with no open-core split. You can self-host it for free, using a setup the README says takes about 90 seconds, or run it on Traceway Cloud if you prefer not to manage infrastructure. It suits engineering teams looking for one tool to find and diagnose production problems.
Key features
- Structured logs linked to traces
- End-to-end distributed tracing waterfalls
- Grouped exception tracking with source maps
- Session replay for web and Flutter
- LLM cost and latency observability
- On-call paging and alerting
Pricing: Free to self-host under the MIT licence with all features included; a hosted Traceway Cloud option is also available.
#2
An open-source platform for visualizing metrics, logs and traces from many data sources, with dashboards, alerting and ad-hoc exploration.
- GitHub stars
- 78k
- Last commit
- today
- Latest release
- v13.3.1
- Licence
- AGPL-3.0
- Self-hosted
- Yes
- Hosted version
- Available
grafana.com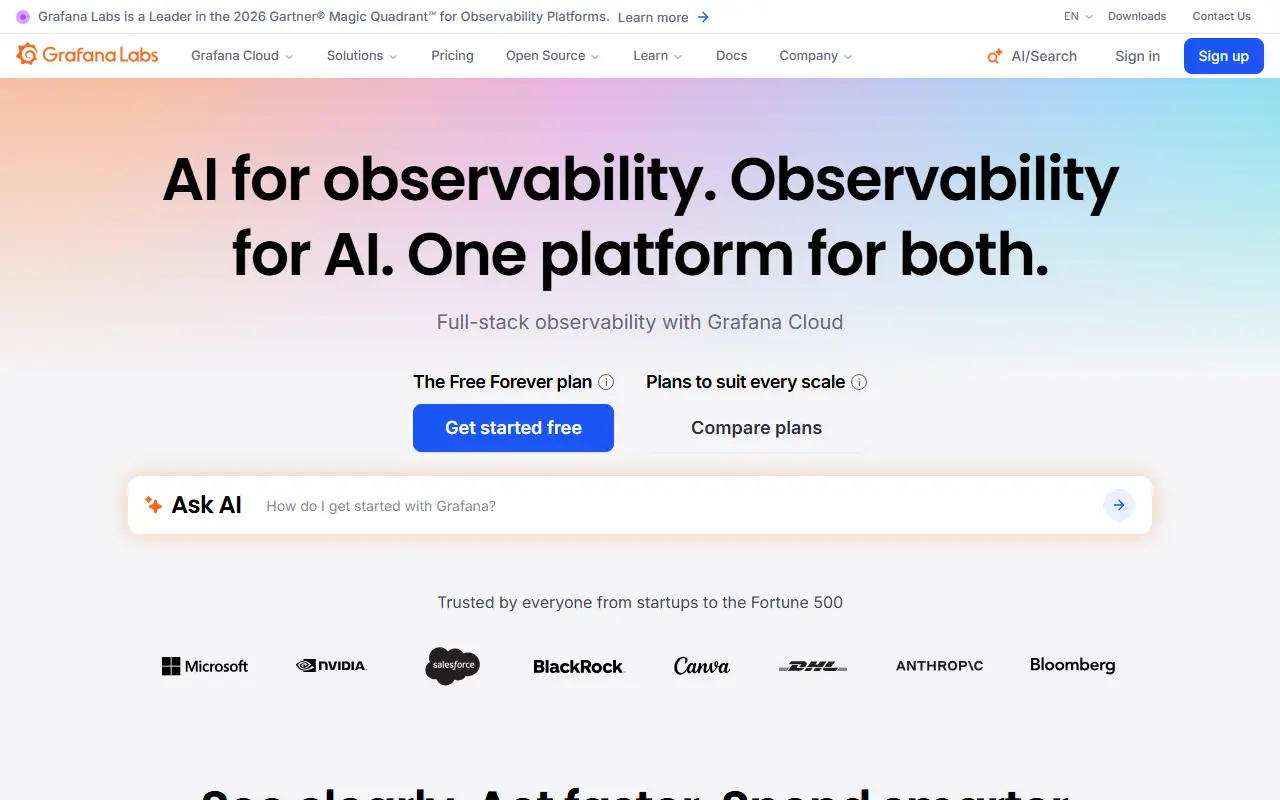
Grafana is a visualization and observability platform that lets you query, chart and alert on data wherever it is stored. It does not hold your data itself; it connects to sources such as Prometheus, Loki, Elasticsearch, InfluxDB, MySQL and PostgreSQL and brings their results together in shared dashboards.
Dashboards can be made reusable with template variables that appear as dropdowns, and a single graph may mix queries against different data sources. Explore views support ad-hoc queries, side-by-side comparison of time ranges and a jump from metrics to logs while keeping label filters. Alert rules are defined visually, and notifications go to systems like Slack, PagerDuty, VictorOps and OpsGenie. Panel plugins add further visualization types.
Grafana is AGPL-3.0 licensed, written in Go and TypeScript, and can be installed on your own servers; Grafana Labs also runs a hosted offering. It is common in DevOps and SRE teams as the dashboard layer on top of Prometheus-style monitoring, and a public demo site lets you try it first.
Key features
- Dashboards with template variables
- Mixed data sources in a single graph
- Visual alert rules with Slack and PagerDuty
- Explore view for ad-hoc metric and log queries
- Panel plugins for extra visualizations
- Connects to Prometheus, Loki and SQL databases
Pricing: Grafana Cloud has an always-free tier with usage limits. Pro starts at $19 per month plus usage; Enterprise starts at a $25,000 annual spend commit and is sold through sales.
#3
A developer-focused platform for error tracking and performance monitoring that helps teams detect, trace and fix issues, with SDKs for most programming languages.
- GitHub stars
- 46k
- Last commit
- today
- Latest release
- 26.10.1
- Self-hosted
- Yes
- Hosted version
- Available
sentry.io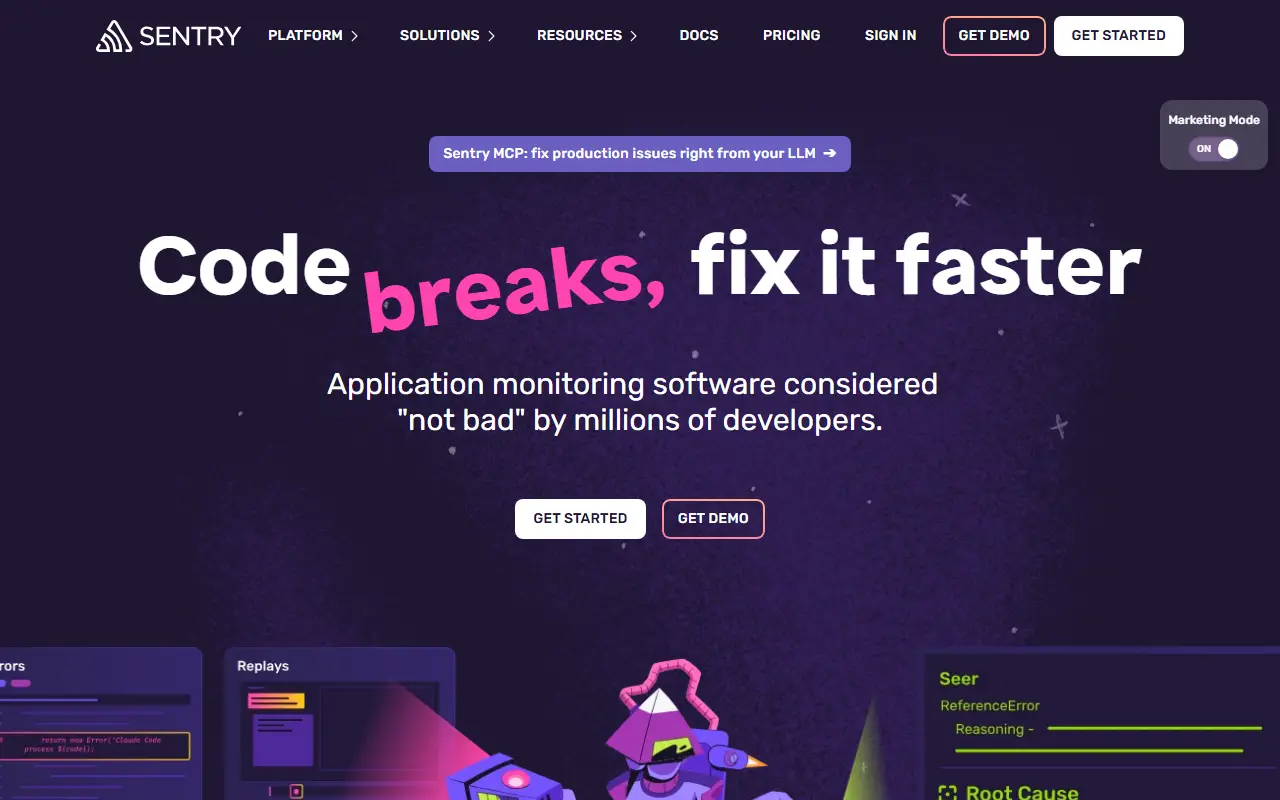
Sentry is a debugging platform that helps developers detect, trace and fix problems in their applications. It collects crash reports and errors from running software, groups them into issues, and adds the context needed to understand what happened, alongside performance monitoring for slow requests and transactions.
Integration happens through official SDKs covering web, mobile, desktop, server and game platforms, from JavaScript, Python and PHP to Go, Rust, Java, Kotlin, Swift, Flutter, Unity, Unreal Engine and Godot. The server itself is a Python application built on Django, and topics also mention CSP report collection and application performance monitoring.
Sentry is source available, and its license is listed as 'Other' on GitHub rather than a standard open-source license. It can be run on your own infrastructure, and the company also operates the hosted service at sentry.io. It is used by engineering teams of all sizes as a first stop when something breaks in production.
Key features
- Error and crash tracking
- Application performance monitoring
- Official SDKs for many languages and frameworks
- Issue grouping with debugging context
- CSP report collection
- Self-hosted or hosted deployment
Pricing: Free Developer plan for one user. Team is $26 per month and Business $80 per month when billed annually, with unlimited users; Enterprise is custom. Usage above the included quota is billed pay-as-you-go.
#4
An open-source observability platform built on OpenTelemetry that unifies APM, logs, metrics, traces, alerts and dashboards in one tool, self-hosted or in the cloud.
- GitHub stars
- 33k
- Last commit
- today
- Latest release
- v0.149.0
- Self-hosted
- Yes
- Hosted version
- Available
signoz.io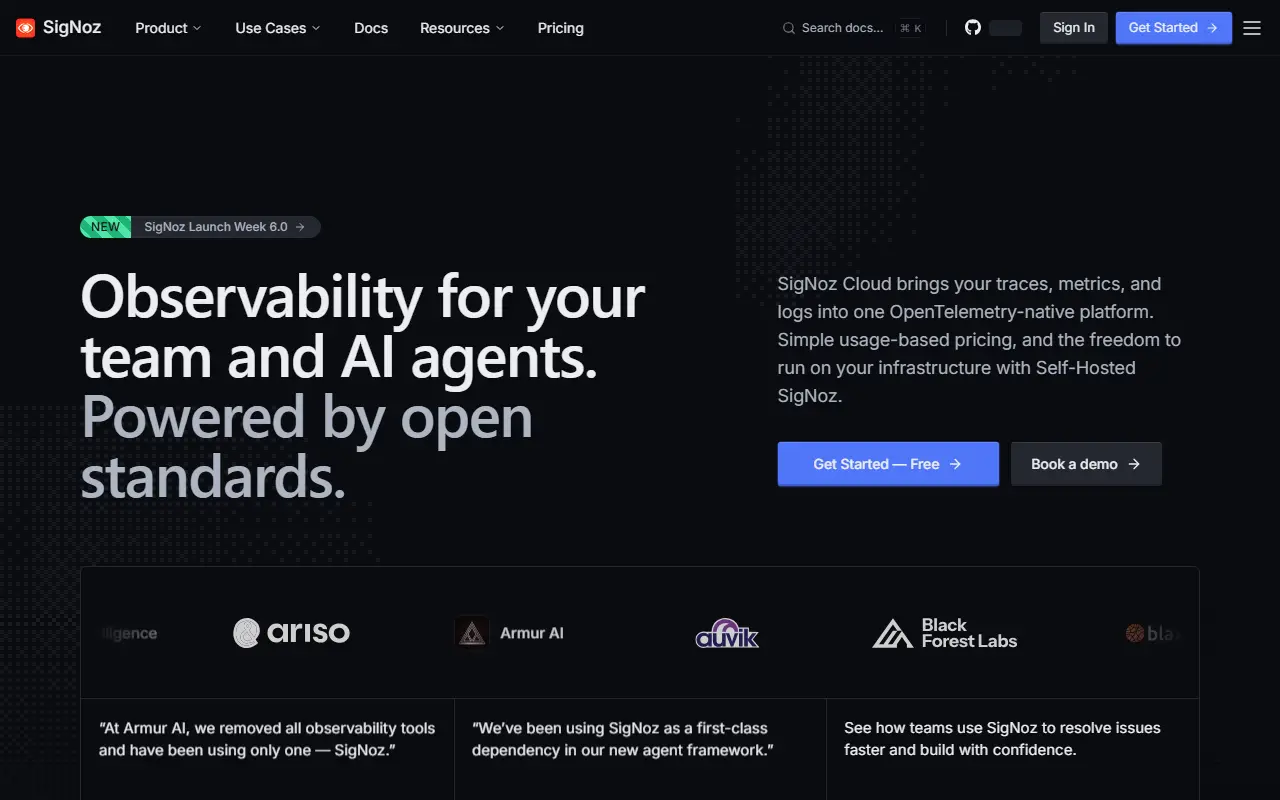
SigNoz is an observability platform, open source and built on OpenTelemetry. It aims to replace a fragmented monitoring stack with a single place for logs, metrics, traces, alerts, exceptions and dashboards, and it presents itself as useful for both engineering teams and their AI agents.
The APM view follows how each service performs, covering latency, error rate, throughput, Apdex, the busiest endpoints, and calls to databases and external services. Log management supports ingesting, searching and correlating logs with traces and metrics through a visual query builder. Dashboards can be built with a query builder, PromQL or ClickHouse SQL, infrastructure monitoring covers Kubernetes clusters, pods, nodes and host resources, and LLM and AI observability traces prompts, tool calls, tokens, latency and cost.
You can choose how to run it. SigNoz Cloud is fully managed, with a 30-day free trial and usage-based pricing that starts at $49. Enterprise options cover cloud, bring-your-own-cloud and self-hosted deployments with extra support and controls. The free Community edition runs in your own infrastructure via Docker, Kubernetes or Linux. The repository license is listed as 'Other' on GitHub.
Key features
- OpenTelemetry-native logs, metrics and traces
- APM with latency, error rate and Apdex
- Log management with a visual query builder
- Dashboards via query builder, PromQL or SQL
- Kubernetes infrastructure monitoring
- LLM and AI application observability
- Alerts and exception tracking
Pricing: Self-hosted Community is free. SigNoz Cloud Teams starts at $49 per month including $49 of usage, then usage-based per GB; Enterprise is custom and starts at $4000 per month.
#5
An open-source observability platform that unifies logs, traces, metrics and session replays on top of ClickHouse and OpenTelemetry, a Kibana-style experience for ClickHouse.
- GitHub stars
- 10k
- Last commit
- today
- Latest release
- cli-v0.9.0
- Licence
- MIT
- Self-hosted
- Yes
- Hosted version
- Available
hyperdx.io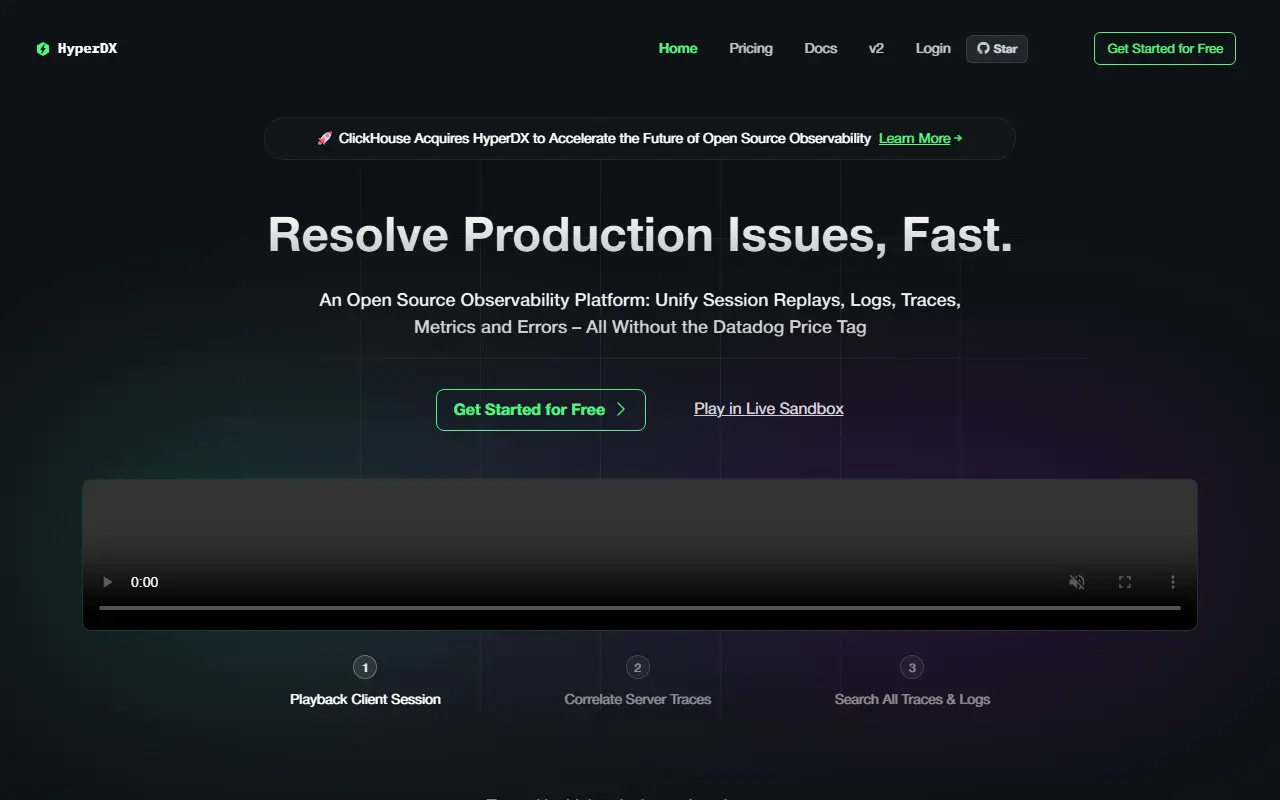
HyperDX is an open-source observability platform for working out why production is broken. It brings logs, metrics, traces, errors and session replays into one place, and works as a search and visualization layer on top of ClickHouse and OpenTelemetry, which the authors compare to Kibana for ClickHouse. It is a core component of ClickStack.
It is schema agnostic and can sit on top of an existing ClickHouse schema. Searching uses full-text and property syntax such as level:err, with SQL as an option, events can be compared with event deltas, high-cardinality events can be charted on dashboards, and alerts can be set up in a few clicks. Live tail shows the newest logs and traces, JSON strings can be queried natively, OpenTelemetry works out of the box, and APM views cover HTTP requests down to database queries.
One deployment option is ClickStack, a bundle of ClickHouse, HyperDX, an OpenTelemetry Collector and MongoDB, and HyperDX can instead be pointed at your own ClickHouse instance. It can also be used with ClickHouse Cloud. The project is MIT licensed and written in TypeScript.
Key features
- Unified logs, metrics, traces and session replays
- Schema-agnostic search on ClickHouse
- Full-text and property search syntax
- Alerts and event delta analysis
- Live tail for logs and traces
- OpenTelemetry support out of the box
- Dashboards for high-cardinality events
Pricing: Free plan stores up to 3 GB a month. Starter is $20 per month flat with 50 GB included and $0.40 per extra GB; Enterprise is custom. No per-seat or per-host billing.
#6
The OpenTelemetry Collector is a vendor-agnostic service that receives, processes and exports traces, metrics and logs so one agent can feed many observability back-ends.
- GitHub stars
- 7.8k
- Last commit
- today
- Latest release
- v0.165.0
- Licence
- Apache-2.0
- Self-hosted
- Yes
opentelemetry.io
This entry covers the OpenTelemetry Collector, the component of the OpenTelemetry project that handles telemetry data in transit. It is a vendor-agnostic implementation for receiving, processing and exporting telemetry, so teams do not need to run separate agents or collectors for each open-source telemetry format such as Jaeger or Prometheus when sending data to several open-source or commercial back-ends.
The project's stated objectives are to be usable, with sensible default configuration and support for popular protocols, performant and stable under varying loads, observable itself, extensible without touching the core code, and unified, with a single codebase that can run as an agent or a collector for traces, metrics and logs. Documentation covers getting started, configuration, security and monitoring.
The Collector is written in Go, licensed under Apache-2.0 and is part of the CNCF ecosystem, with a special interest group that meets weekly. You deploy it yourself next to your applications or as a central gateway. It suits platform and SRE teams standardizing telemetry pipelines.
Key features
- Receives telemetry in many protocols
- Processes and transforms traces, metrics and logs
- Exports to open-source and commercial back-ends
- Runs as an agent or a gateway
- Extensible through components
- Sensible default configuration
Pricing: Free and open source under the Apache-2.0 licence.
#7
Self-hosted Sentry packaged with Docker Compose, for running the error and performance monitoring platform on your own server.
- GitHub stars
- 9.7k
- Last commit
- 4 days ago
- Latest release
- 26.10.1
- Self-hosted
- Yes
- Hosted version
- Available
develop.sentry.dev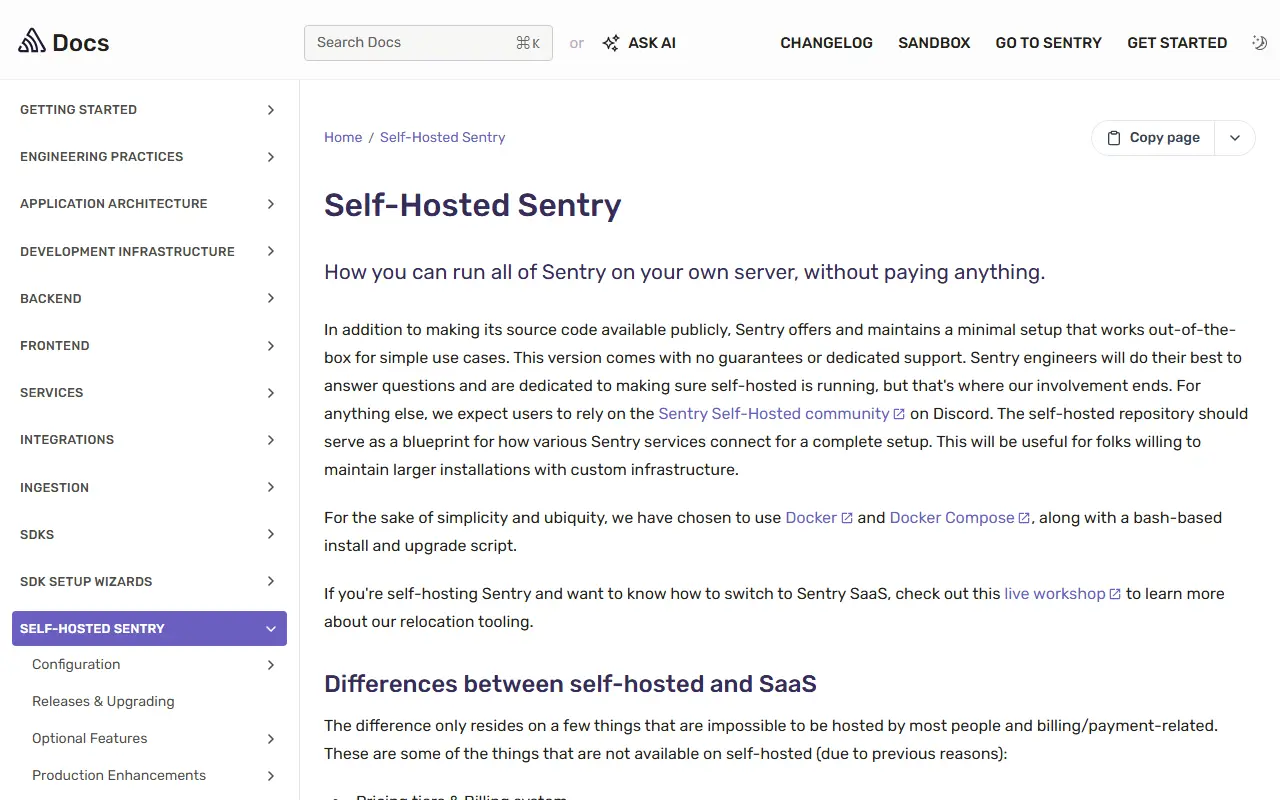
This repository packages Sentry for self-hosting. It lets organizations run the whole Sentry platform on their own server without paying for the hosted product, and the project describes it as feature-complete but aimed at low-volume deployments and proofs of concept. The entry is listed under the name Develop, taken from the documentation site.
Sentry maintains a minimal setup that works out of the box for simple cases, built on Docker and Docker Compose with a bash-based install and upgrade script. It comes with no guarantees or dedicated support, so users are expected to rely on the community on Discord. For larger installations the repository acts as a blueprint of how Sentry services connect, and the docs cover configuration, upgrades, backup and restore, and production enhancements.
The code is distributed under Sentry's fair-source license rather than a standard open-source one. Documentation also explains the small number of differences between self-hosted and the SaaS version, along with relocation tooling for moving to Sentry's hosted service.
Key features
- Complete Sentry stack for self-hosting
- Docker Compose based installation
- Install and upgrade scripts
- Backup and restore documentation
- Reference architectures for larger installs
Pricing: Free to self-host under Sentry's fair-source license with no guaranteed support; a hosted SaaS version is also available.
#8
An open-source full-stack monitoring platform that combines session replay, error monitoring, logging and distributed tracing, offered hosted or self-hosted.
- GitHub stars
- 9.4k
- Last commit
- 20 days ago
- Latest release
- docker-v0.5.6
- Self-hosted
- Yes
- Hosted version
- Available
app.highlight.io
Highlight, at highlight.io, is an open-source monitoring platform for developers. Its aim is to give teams one cohesive tool covering the front end and back end, instead of separate products for errors, logs and user sessions.
The core features are session replay, error monitoring and logging, with tracing and metrics also in scope. Console logs from the front end can be analyzed, and errors are embedded alongside the session in which they happened, so you can see what the user was doing beforehand. Session comments let teams discuss user frustration or bugs, there are integrations with other tools, and client SDKs install with a few lines of code.
You can sign up for the free-to-start hosted version at app.highlight.io, or deploy a hobby instance on Linux with Docker, sized at roughly 8 GB of memory, four CPUs and 64 GB of storage. The code is written in TypeScript and Go, and the repository lists the license as Other, so check the licence file for terms.
Key features
- Session replay for user interactions
- Error monitoring tied to sessions
- Logging and console log analysis
- Distributed tracing and metrics
- Session comments for team discussion
- Client SDKs for several platforms
- Docker hobby self-hosting
Pricing: A hosted version is free to start; a hobby self-hosted instance is available. The repository lists the license as Other.
#9
An open-source APM that combines OpenTelemetry traces, metrics and logs in one interface, backed by ClickHouse and PostgreSQL.
- GitHub stars
- 4.3k
- Last commit
- yesterday
- Latest release
- v2.1.0-rc.3
- Licence
- AGPL-3.0
- Self-hosted
- Yes
uptrace.dev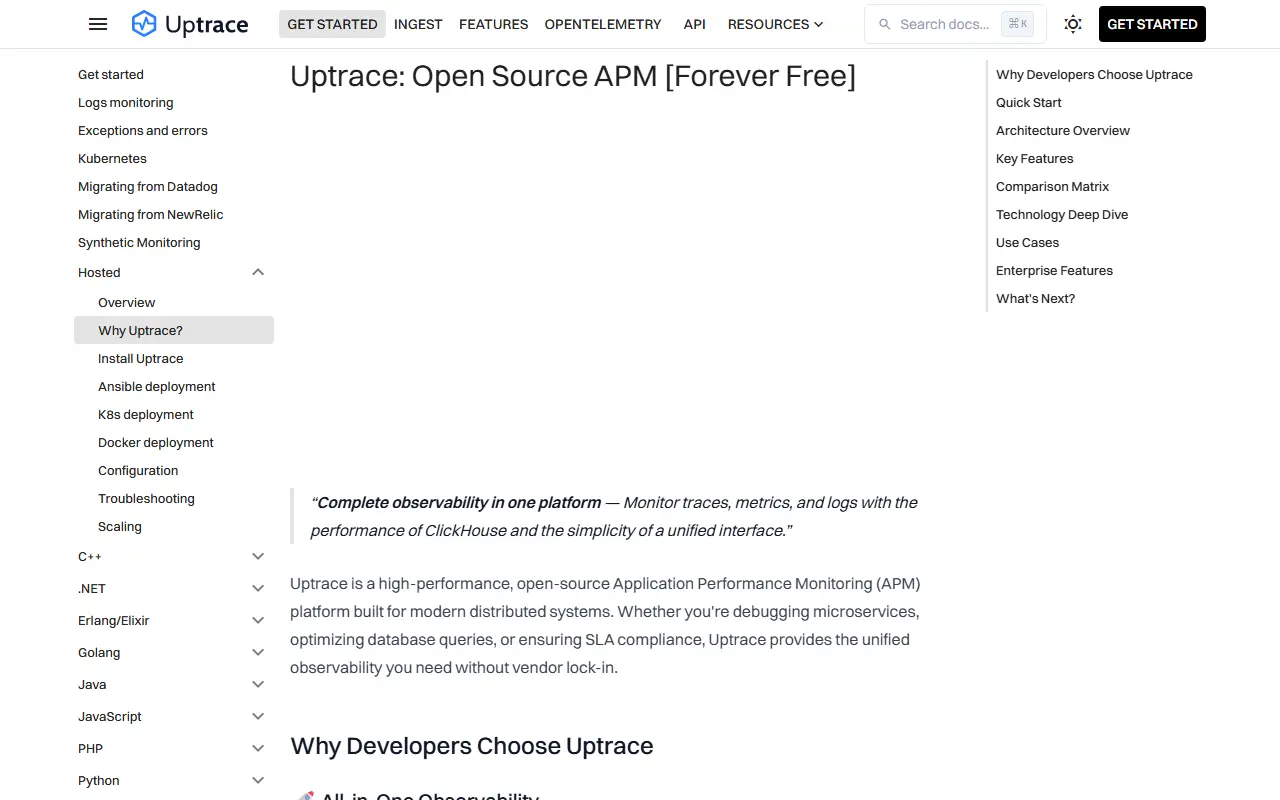
Uptrace is an open-source application performance monitoring platform. It collects distributed traces, metrics and logs through OpenTelemetry and presents them in a single interface, so teams can monitor applications and troubleshoot problems without switching between separate tracing, metrics and logging tools.
The interface includes a query builder, a service graph, faceted filters, chart annotations and many prebuilt dashboards that appear automatically as metrics arrive. Alerting rules send notifications through email, Slack, WebHook or AlertManager. Data can be ingested via OpenTelemetry, Prometheus, Vector, FluentBit and CloudWatch, Grafana can use Uptrace as a Tempo or Prometheus data source, and single sign-on works through OpenID Connect.
Uptrace is written in Go with a Vue front end, stores telemetry in ClickHouse and keeps metadata such as alerts in PostgreSQL. It is licensed under AGPL-3.0 and can be self-hosted with Docker, and a cloud demo needs no login. The project says it is meant to cut monitoring costs, which suits engineering teams comparing self-hosted APM options with commercial observability suites.
Key features
- Unified view of traces, metrics, and logs
- Prebuilt dashboards created automatically
- Alert notifications via Email, Slack, and WebHook
- SQL-like query language for spans
- Grafana Tempo and Prometheus compatibility
- OpenID Connect single sign-on
Pricing: Free and open source under the AGPL-3.0 licence.
#10
Real-time error and event reporting for JavaScript, Node, and .NET applications, available as a hosted service or self-hosted with Docker.
- GitHub stars
- 2.5k
- Last commit
- today
- Latest release
- v8.10.1
- Licence
- Apache-2.0
- Self-hosted
- Yes
- Hosted version
- Available
exceptionless.com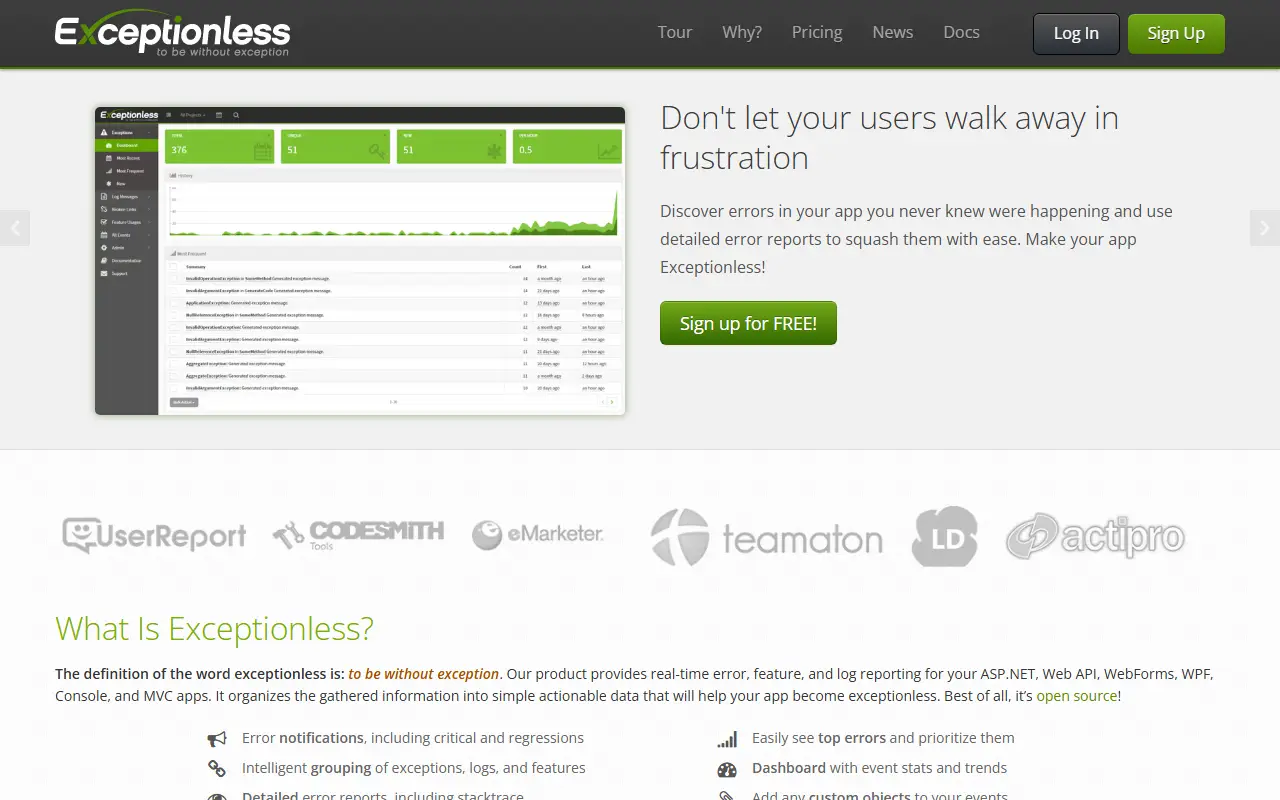
Exceptionless provides real-time error reporting for JavaScript, Node, .NET Core, ASP.NET, Web API, WebForms, WPF, console, and MVC applications. It gathers exceptions and logs, groups them into simple actionable data, and helps teams fix problems quickly. The name means without exception. It is released under the Apache-2.0 license.
The topics mention error monitoring, crash reporting, logging, bug tracking, Elasticsearch, Redis, and the Foundatio library, which indicate the stack behind the server. The application is written in C# with a JavaScript front end.
You can use the hosted service run by the project, which the maintainers describe as reasonably priced and as a way to support the project, along with setup and support services, or run the server yourself. A single Docker command starts a local instance on port 7110. It suits development teams who want an open-source alternative to commercial error-tracking tools.
Key features
- Real-time error and exception reporting
- Support for JavaScript, Node, and .NET apps
- Grouped, actionable error data
- Event logging
- Docker one-command local setup
- Hosted service or self-hosting
Pricing: A free plan includes 3,000 events per month. Paid plans range from $15 (Small) to $499 (Enterprise) per month, mainly by event volume; self-hosting is also possible.
Scout Monitoring alternatives: questions
- What is the best open-source alternative to Scout Monitoring?
- Traceway is the top-ranked open-source alternative to Scout Monitoring on Enlisted: An OpenTelemetry-native observability platform combining logs, traces, metrics, exceptions, session replay and AI tracing, self-hosted or in the cloud. Other strong options are Grafana, Sentry, SigNoz and HyperDX.
- What are the best commercial alternatives to Scout Monitoring?
- Airbrake, AppSignal, Honeybadger, Blackfire and Rollbar are among the hosted, closed-source alternatives to Scout Monitoring listed on Enlisted, which lists 12 in total. Compare their pricing and features on each tool page.
- Are these Scout Monitoring alternatives free?
- All 10 are open source, so the code is free to use under its licence, and all of them can be self-hosted on your own server or computer. 8 also offer a paid or managed cloud version if you'd rather not host it yourself.
- How is this list of Scout Monitoring alternatives ranked?
- By a score built from GitHub stars, star growth over the last 30 days and how recently the code changed. 10 of these projects shipped code in the last 30 days. Data is refreshed daily, and nobody can pay to move up.
 TrackMedia
 TrackRev