#1
An open-source platform for visualizing metrics, logs and traces from many data sources, with dashboards, alerting and ad-hoc exploration.
- GitHub stars
- 78k
- Last commit
- today
- Latest release
- v13.3.1
- Licence
- AGPL-3.0
- Self-hosted
- Yes
- Hosted version
- Available
grafana.com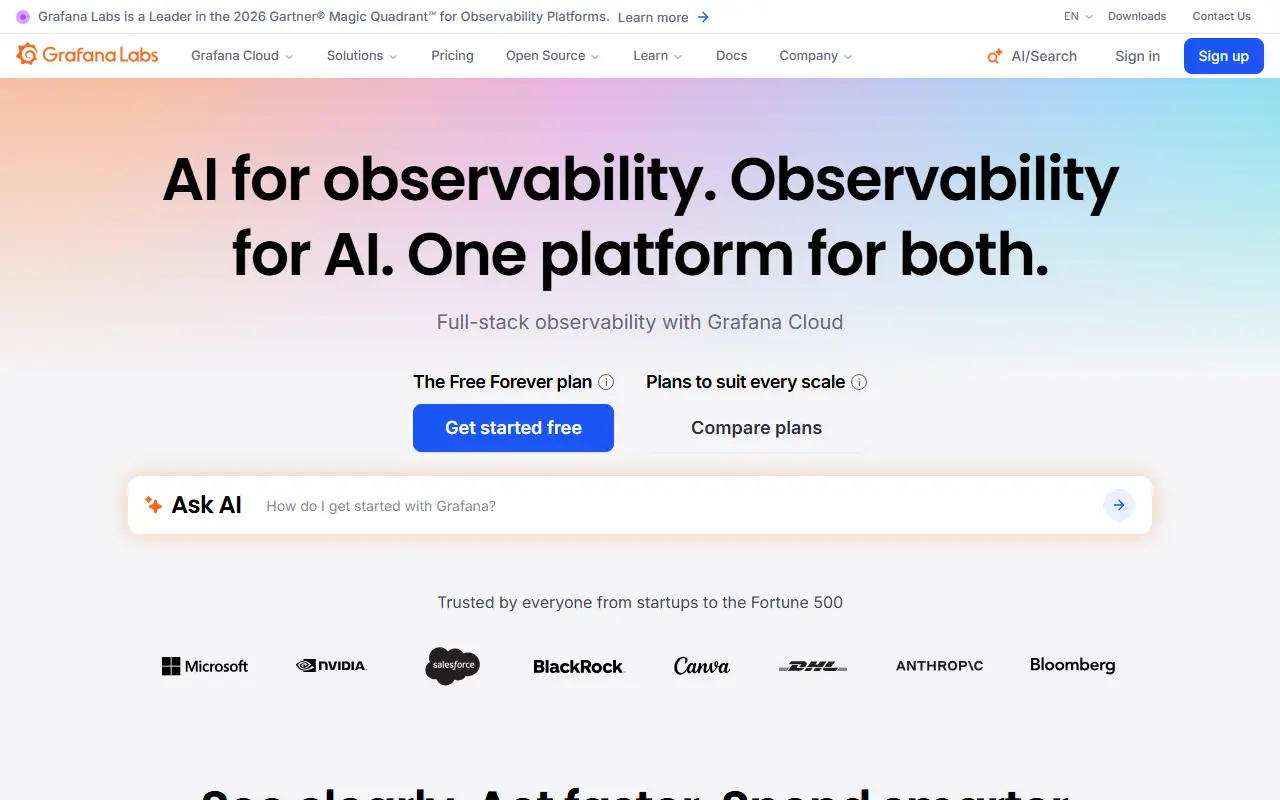
Grafana is a visualization and observability platform that lets you query, chart and alert on data wherever it is stored. It does not hold your data itself; it connects to sources such as Prometheus, Loki, Elasticsearch, InfluxDB, MySQL and PostgreSQL and brings their results together in shared dashboards.
Dashboards can be made reusable with template variables that appear as dropdowns, and a single graph may mix queries against different data sources. Explore views support ad-hoc queries, side-by-side comparison of time ranges and a jump from metrics to logs while keeping label filters. Alert rules are defined visually, and notifications go to systems like Slack, PagerDuty, VictorOps and OpsGenie. Panel plugins add further visualization types.
Grafana is AGPL-3.0 licensed, written in Go and TypeScript, and can be installed on your own servers; Grafana Labs also runs a hosted offering. It is common in DevOps and SRE teams as the dashboard layer on top of Prometheus-style monitoring, and a public demo site lets you try it first.
Key features
- Dashboards with template variables
- Mixed data sources in a single graph
- Visual alert rules with Slack and PagerDuty
- Explore view for ad-hoc metric and log queries
- Panel plugins for extra visualizations
- Connects to Prometheus, Loki and SQL databases
Pricing: Grafana Cloud has an always-free tier with usage limits. Pro starts at $19 per month plus usage; Enterprise starts at a $25,000 annual spend commit and is sold through sales.
#2
A privacy-first web analytics platform covering traffic, campaigns, behavior, conversions and revenue without cookies, available self-hosted or in the cloud.
- GitHub stars
- 40k
- Last commit
- yesterday
- Latest release
- v3.5.0
- Licence
- MIT
- Self-hosted
- Yes
- Hosted version
- Available
umami.is
Umami is a privacy-focused web analytics platform and a common open-source alternative to Google Analytics. It brings traffic, campaign performance, user behavior, conversions and revenue into one dashboard, and it does so without cookies and without cross-site surveillance of visitors.
Topics show it also supports audience segmentation, cohort analysis and user journey views alongside standard statistics and charts. The app is built with TypeScript and runs on Node.js 18.18 or newer with a PostgreSQL database of version 12.14 or newer. Optional settings let you change the API base URL, enable two-factor authentication by providing an encryption key, and switch on an MCP endpoint, which is disabled by default.
Umami is MIT licensed and can be installed from source or run on your own infrastructure; the project also offers a hosted cloud version for teams that do not want to maintain servers. A detailed getting-started guide lives at umami.is/docs. It suits site owners and product teams who want clean, compliant analytics they control.
Key features
- Cookie-free web analytics
- Traffic, campaign and conversion tracking
- Revenue and conversion tracking
- Cohort analysis and audience segmentation
- User journey views
- Optional two-factor authentication and MCP endpoint
Pricing: Free and open source under the MIT license; a hosted cloud version is also available.
#3
An open-source product platform combining analytics, session replay, feature flags, experiments, surveys and error tracking, with AI that turns signals into reports.
- GitHub stars
- 41k
- Last commit
- today
- Latest release
- desktop-v0.61.1016
- Self-hosted
- Yes
- Hosted version
- Available
posthog.com
PostHog is an open-source platform that bundles the tools product teams use to understand and improve what they ship. It captures event data, user sessions and errors in one place, and its newer self-driving mode aims to turn signals such as errors, rage clicks and failed queries into researched reports and pull requests that engineers review and merge.
The product suite includes product analytics with autocapture or manual instrumentation and SQL analysis, web analytics with a dashboard resembling Google Analytics, session replays for web and mobile, feature flags, experiments with statistical measurement, surveys, error tracking, logs, a data warehouse and a customer data platform. The back end is Python and the front end is React and TypeScript.
PostHog's repository license is listed as 'Other' on GitHub, so check which parts are open source and which are enterprise-only. It can be self-hosted, and the company also runs a managed cloud service. It suits product and engineering teams that prefer a single tool over separate analytics, flagging and replay vendors.
Key features
- Product analytics with autocapture and SQL
- Web analytics dashboard
- Session replay for web and mobile
- Feature flags and experiments
- Surveys and error tracking
- Data warehouse and customer data platform
- AI-assisted detection of product issues
Pricing: Every product has a free monthly tier with no credit card needed. Pay-as-you-go charges only for usage beyond the free limits; per-unit rates are not shown here and volume discounts are available.
#4
A lightweight, cookie-free, privacy-first web analytics tool and Google Analytics alternative, available as a managed cloud or a self-hosted community edition.
- GitHub stars
- 30k
- Last commit
- today
- Latest release
- v3.2.1
- Licence
- AGPL-3.0
- Self-hosted
- Yes
- Hosted version
- Available
plausible.io
Plausible Analytics is an open-source web analytics tool built around privacy. It is a lightweight, cookie-free alternative to Google Analytics that measures traffic rather than individuals: it keeps no personal data or IP addresses and uses no persistent identifiers, and the project states compliance with GDPR, CCPA and PECR. The company is made and hosted in the EU.
The dashboard is deliberately simple, with the key insights on a single page and no layers of menus or custom reports to build. The tracking script is tiny, which helps pages load faster, and you can also send custom events to measure goals. The stack uses Elixir with Phoenix, PostgreSQL and ClickHouse, with Tailwind CSS for the interface.
Plausible is AGPL-3.0 licensed and comes in two forms: a managed cloud service run by the company, which is paid, and a self-hosted community edition you operate yourself. A live demo and documentation let you try the dashboard first. It suits site owners and marketers who want straightforward, compliant analytics without cookie banners.
Key features
- Cookie-free, privacy-first tracking
- Single-page, clutter-free dashboard
- Lightweight tracking script
- Custom event and goal tracking
- GDPR, CCPA and PECR compliance
- Managed cloud or self-hosted edition
Pricing: Plans are priced by monthly pageviews: for up to 10k pageviews Starter is $9, Growth $14 and Business $19 per month. Enterprise is custom; there is a 30-day free trial.
GoAccess is an open source real-time web log analyzer that runs in a terminal or produces an HTML, JSON or CSV report.
- GitHub stars
- 21k
- Last commit
- 3 days ago
- Licence
- MIT
- Self-hosted
- Yes
goaccess.io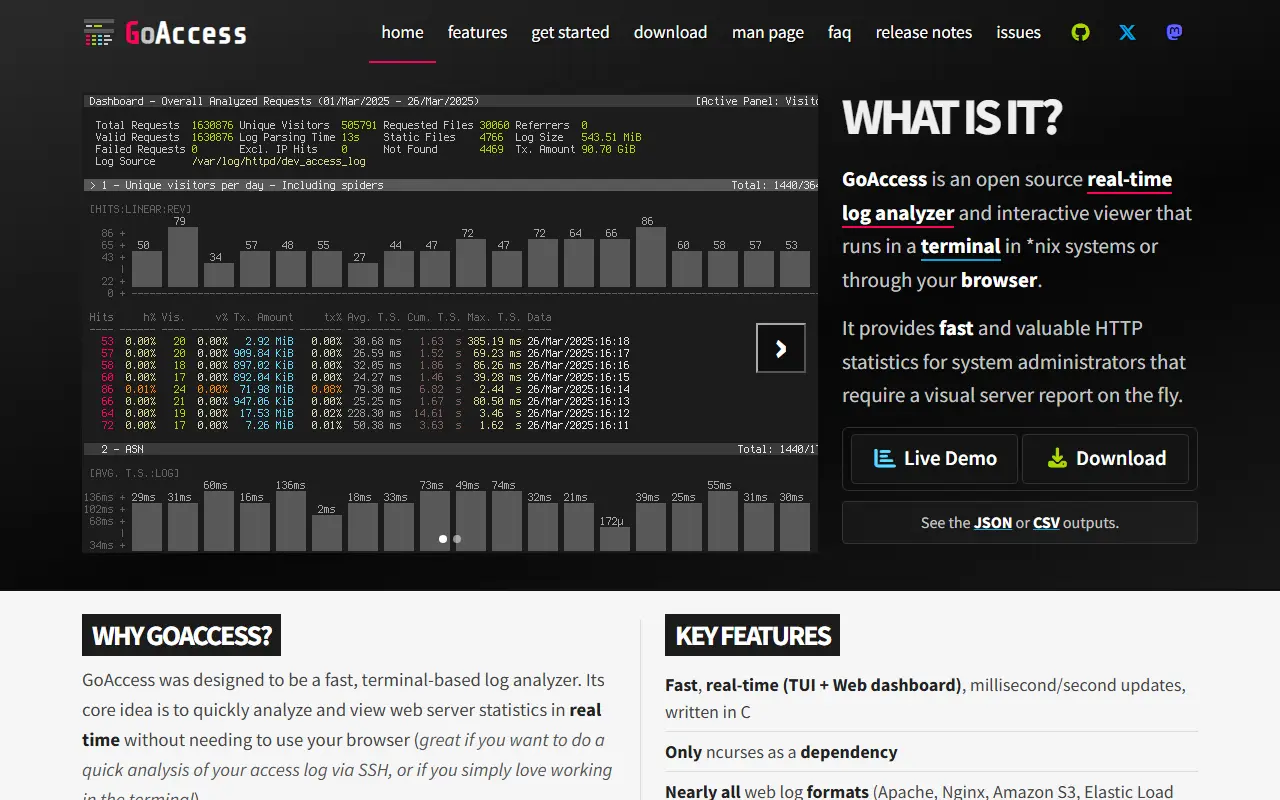
GoAccess is an open source log analyzer and interactive viewer written in C. It runs in a terminal on *nix systems or through a browser, and gives system administrators quick HTTP statistics without sending logs to another service.
The terminal view is the default, which is handy for a quick look at an access log over SSH. It can also generate a self-contained, real-time HTML report, and JSON and CSV output are available. The site adds that it helps spot suspicious activity such as scanners, bots and brute-force attempts.
Nearly all common web log formats are handled, including Apache, Nginx, Amazon S3, Elastic Load Balancing, CloudFront and Caddy. You set the log format and run it against your log. The only dependency is ncurses, and it is MIT-licensed.
Key features
- Real-time terminal and web dashboard
- Supports many web server log formats
- Self-contained real-time HTML report
- JSON and CSV output
- Helps spot suspicious traffic

A full-featured open-source web analytics platform in PHP and MySQL that you run on your own server, built as a privacy-conscious alternative to Google Analytics.
- GitHub stars
- 22k
- Last commit
- today
- Latest release
- 5.14.2
- Licence
- GPL-3.0
- Self-hosted
- Yes
- Hosted version
- Available
matomo.org
Matomo, formerly known as Piwik, is an open web analytics platform written in PHP with MySQL storage. You download and install it on your own web server, and after a short installation you receive a JavaScript tracking tag to paste into the sites you want to measure, then see reports in real time. It positions itself as a free-software substitute for Google Analytics.
Privacy is built in, and its mission statement stresses giving every user full control of their data. According to the README it is used on more than 1,400,000 websites. Requirements are PHP 8.1 or newer, MySQL 8.0 or newer or MariaDB 10.6 or newer, and the PDO MySQL or MySQLi extension, and it is independent of operating system and web server. Topics also reference marketing and mobile analytics.
Matomo is released under the GPL-3.0 (or later) license. Self-hosting keeps data on your own servers, and the organization also offers Matomo Cloud as a managed option, with a marketplace of plugins. It suits organizations with data-protection requirements, such as public bodies and companies in privacy-regulated markets, that need dependable analytics they control.
Key features
- Real-time web analytics reports
- Self-hosted PHP and MySQL application
- JavaScript tracking tag installation
- Privacy-focused data ownership
- Mobile and intranet analytics topics
- Matomo Cloud as a managed option
Pricing: The self-hosted Community edition is free. Matomo Cloud starts at $26 a month for 50,000 hits and scales with traffic; a free trial is offered and Enterprise is quoted on request.
#7
A cookieless, privacy-friendly open-source web and product analytics platform offered as a hosted service or for self-hosting, positioned as an alternative to Google Analytics.
- GitHub stars
- 13k
- Last commit
- 9 days ago
- Latest release
- v2.9.2
- Licence
- AGPL-3.0
- Self-hosted
- Yes
- Hosted version
- Available
rybbit.com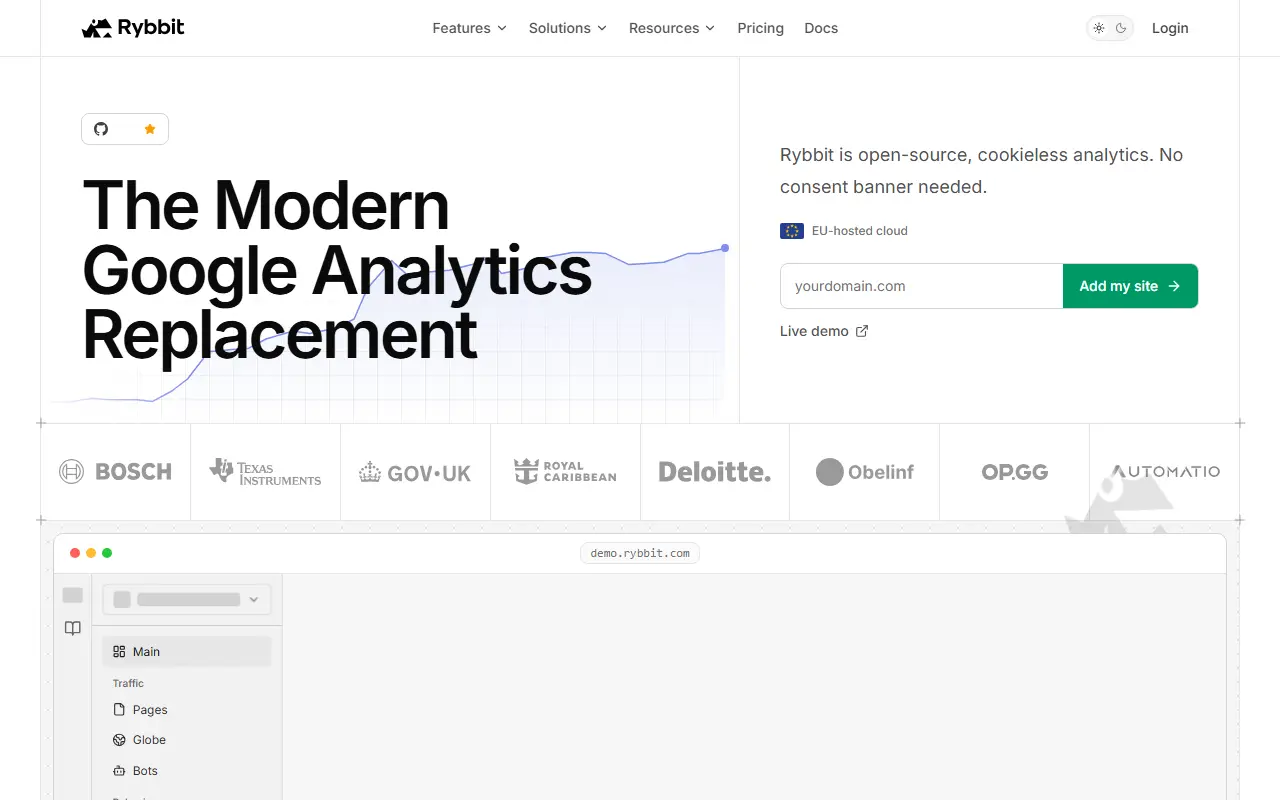
Rybbit is an open-source web and product analytics platform that avoids cookies and aims to be easier to read than traditional analytics suites. It is presented as a privacy-friendly alternative to Google Analytics and can be set up in a couple of minutes with a tracking script added to a site.
It covers the usual web metrics, including sessions, unique users, pageviews, bounce rate and session duration, and goes further with session replays, funnels, retention and user journey dashboards. Data can be filtered across more than fifteen dimensions, custom events carry JSON properties, locations are tracked down to city level with map views, and a real-time dashboard is included. Organizations and an unlimited number of sites are supported.
Rybbit is licensed under AGPL-3.0 and written in TypeScript. You can use the hosted service for the quickest start or deploy it on your own VPS for full control, and a live demo shows it running on a production site. The README compares it with GA4, Plausible and Cloudflare analytics on openness, self-hosting and privacy.
Key features
- Cookieless, privacy-friendly tracking
- Sessions, pageviews, bounce rate and duration
- Session replays of user visits
- Funnels, retention and user journeys
- Custom events with JSON properties
- City-level location tracking with maps
- Real-time analytics dashboard
- Multiple organizations and unlimited sites
Pricing: Standard is $13 and Pro $26 per month on annual billing for 100,000 monthly pageviews, rising with traffic. Includes a 7-day free trial; Enterprise is custom.
#8
Kibana is the web interface for querying, visualizing and managing data stored in Elasticsearch, used for dashboards, observability and analytics.
- GitHub stars
- 21k
- Last commit
- yesterday
- Latest release
- v9.5.6
- Self-hosted
- Yes
- Hosted version
- Available
elastic.co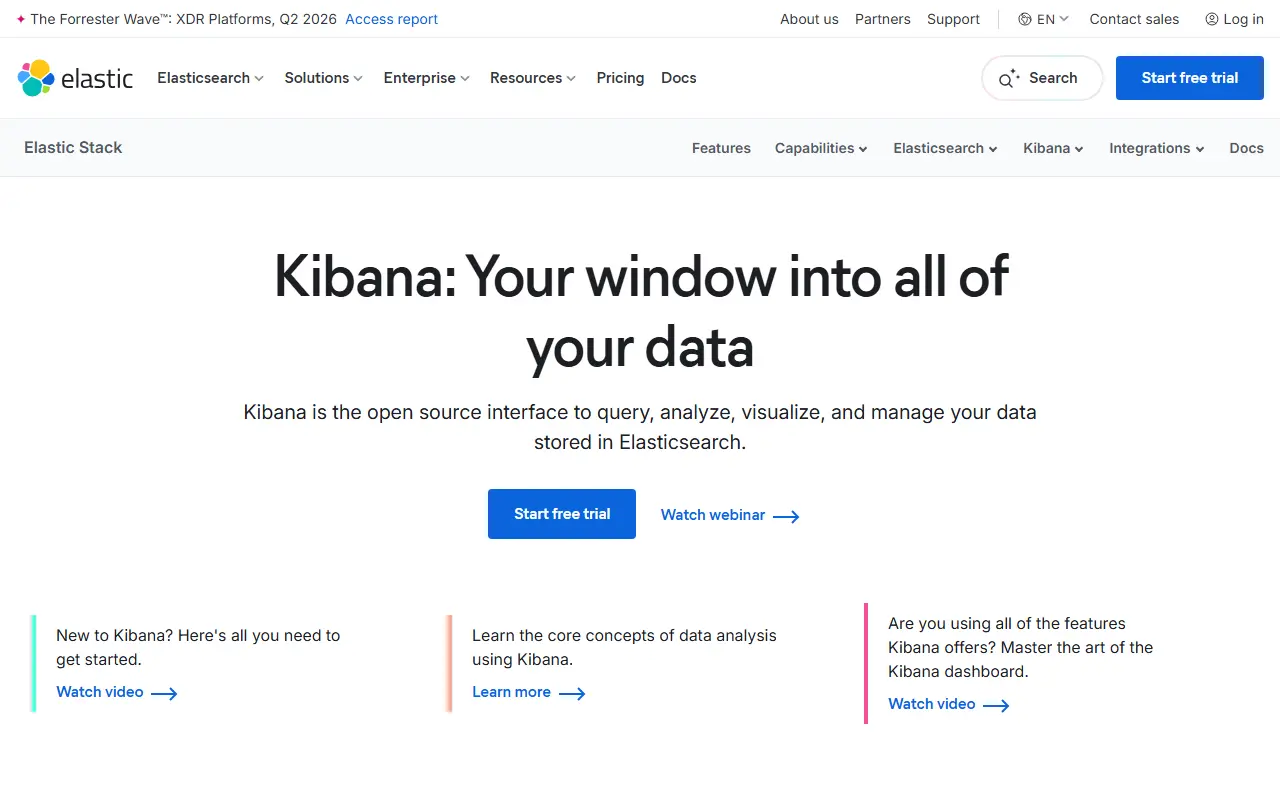
Kibana is the user interface that sits on top of Elasticsearch. It lets people query, analyze, visualize and manage the data stored there, turning indexes into charts, metrics views and dashboards. It is part of the Elastic Stack and is commonly used for log analysis, observability and general analytics work.
Teams build visualizations and assemble them into shared dashboards, explore documents with search, and use the interface to manage parts of an Elasticsearch deployment. The project advises running Kibana and Elasticsearch at the same version, with major versions required to match, because mismatches can cause problems and support may ask for an upgrade first.
The code is written in TypeScript. The repository lists its license as 'Other' rather than a standard SPDX identifier, so the license files should be read for the exact terms. Kibana can be downloaded and run on your own infrastructure, and Elastic also offers a hosted version through its Cloud service.
Key features
- Query and explore Elasticsearch data
- Visualizations and metrics charts
- Shared dashboards for monitoring
- Observability views for logs and metrics
- Management tools for Elasticsearch data
- Hosted option through Elastic Cloud

Snowplow is a behavioral data collection pipeline that gathers event-level data and delivers it to warehouses, lakes and streams; newer versions use a limited-use licence.
- GitHub stars
- 7.1k
- Last commit
- 24 days ago
- Latest release
- 22.01
- Licence
- Apache-2.0
- Self-hosted
- Yes
snowplow.io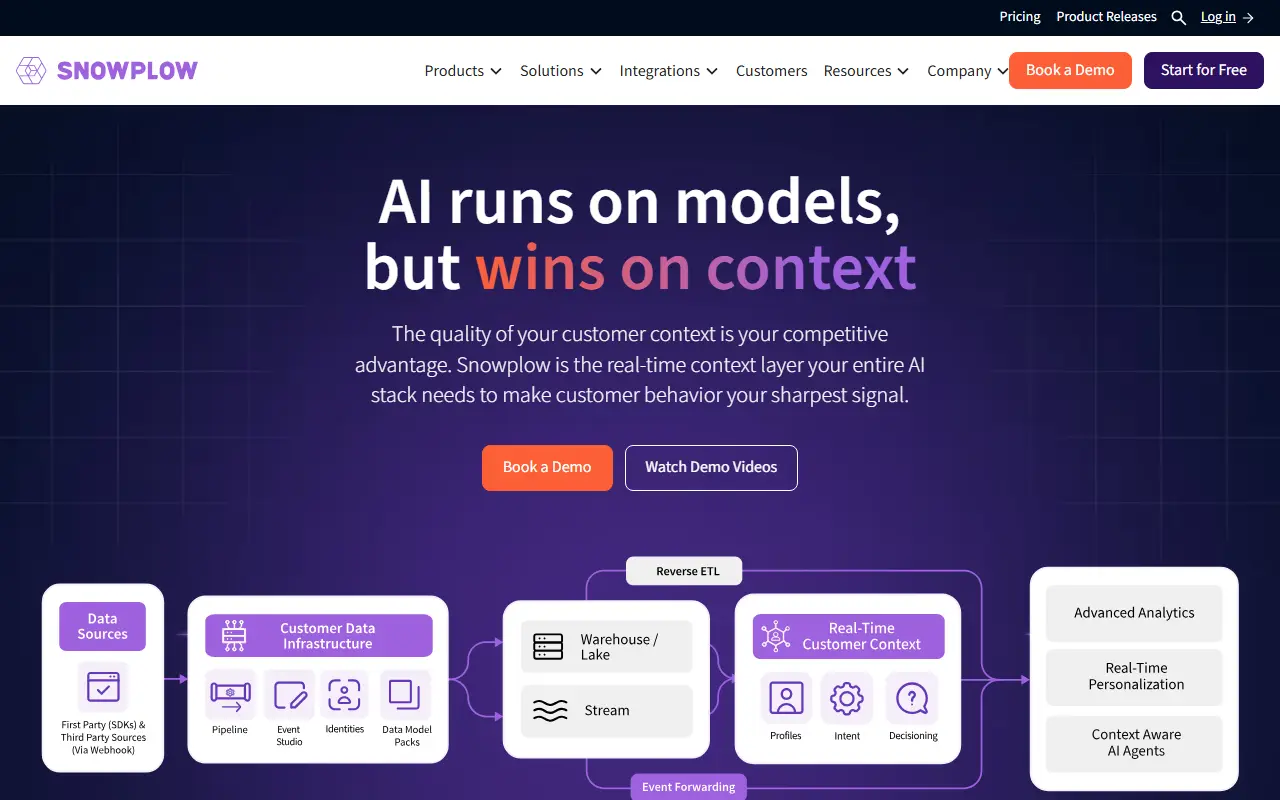
Snowplow is customer data infrastructure for collecting and processing behavioral event data in real time. It gathers event-level data from websites, apps and other sources and delivers it to a data warehouse, lake or stream, where it can feed analytics, personalization, fraud detection and AI agents with customer context.
The repository describes a Customer Context Layer with key benefits around data depth and quality, centralized governance and real-time operationalization. The topics point to data pipelines, product analytics and marketing analytics. The pipeline is written mainly in Scala and has been developed since 2012.
The README carries an important notice: since January 8, 2024, new versions of the core pipeline are released under the Snowplow Limited Use License Agreement, and versions from before January 2024 receive no security patches. Users running the pipeline in production or competing with Snowplow are told they are affected and should contact the company. The older code was Apache-2.0, which the repository still lists. Teams should read the current terms before adopting it.
Key features
- Event-level behavioral data collection
- Delivery to warehouses, lakes, and streams
- Real-time data processing
- Governance and data quality focus
- Support for product and marketing analytics
- Scala-based pipeline components
Pricing: A self-managed open-source environment for testing is listed at no cost, plus a 14-day free trial. The self-hosted pipeline and managed Platform are quoted individually, based on event volume and hosting.
#10
Countly is a privacy-focused product analytics and customer engagement platform for web, mobile, desktop and IoT apps that you can run on-premises.
- GitHub stars
- 5.9k
- Last commit
- today
- Latest release
- 25.03.58
- Self-hosted
- Yes
- Hosted version
- Available
countly.com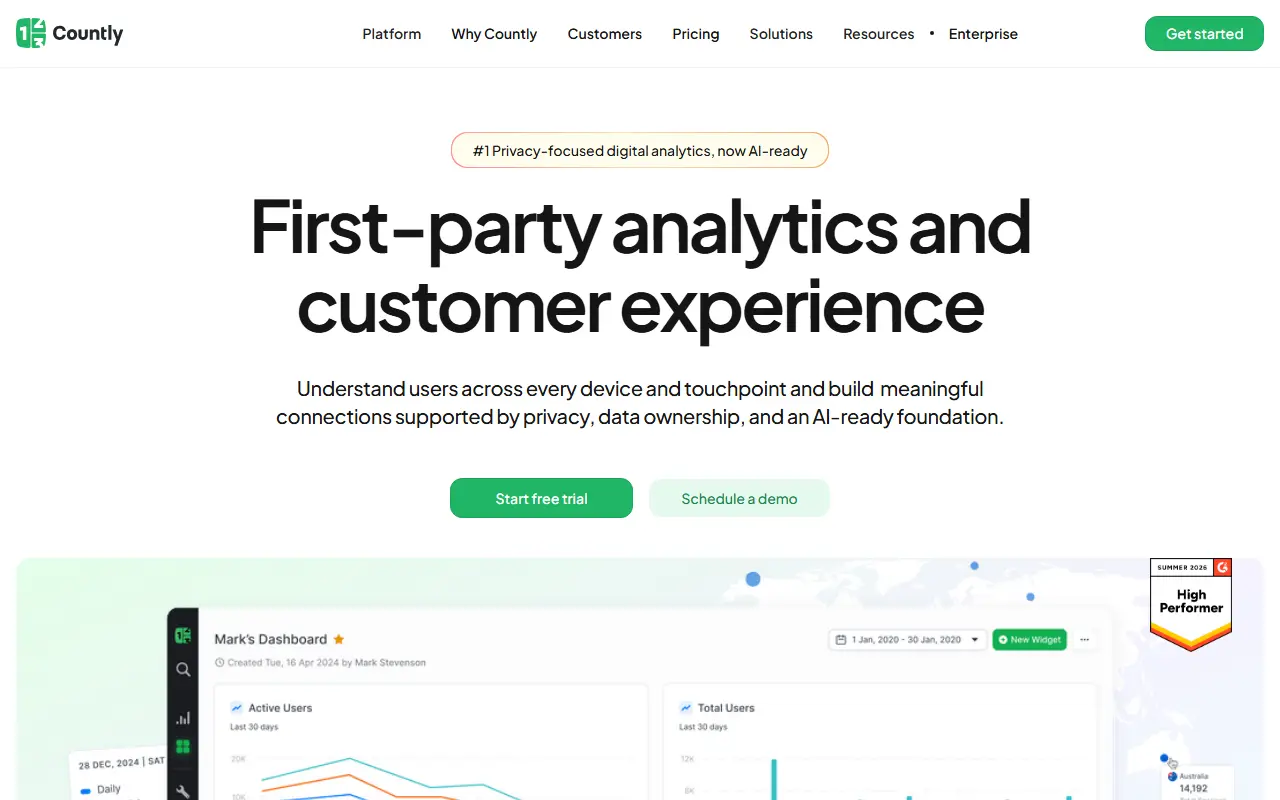
Countly is a product analytics and customer engagement system for organizations that insist on owning their data. Teams use it to see how people behave in mobile, web, desktop and connected products, to improve product experiences, and to automate and personalize how they engage with customers.
The repository topics reflect a broad toolset: web and mobile analytics, crash analytics, push notifications, feature flags, remote configuration, user feedback, dashboards and user journeys. Privacy is a central theme, with references to GDPR, COPPA and HIPAA, and the README stresses that, unlike SaaS-only tools, it can run on your own premises or inside a private cloud. SDKs are provided for many platforms, and the project has a Discord community.
The server code is JavaScript and published under a license that GitHub lists as 'Other', so check the repository for the terms that apply to the edition you use. Countly also offers hosted and enterprise options through the vendor. It suits product and marketing teams that need analytics without sending data to a third party.
Key features
- Cross-platform product and user analytics
- Crash reporting for mobile apps
- Push notifications and engagement tools
- Feature flags and remote configuration
- User feedback collection
- On-premises or private cloud deployment
Pricing: Free self-hosted Lite edition. Flex starts at $175 per month on a managed private cloud with usage-based pricing and a 14-day trial; Enterprise is custom.
Chartbeat alternatives: questions
- What is the best open-source alternative to Chartbeat?
- Grafana is the top-ranked open-source alternative to Chartbeat on Enlisted: An open-source platform for visualizing metrics, logs and traces from many data sources, with dashboards, alerting and ad-hoc exploration. Other strong options are Umami, PostHog, Plausible and GoAccess.
- What are the best commercial alternatives to Chartbeat?
- Parse.ly, GoSquared, Usermaven, Kissmetrics and Heap are among the hosted, closed-source alternatives to Chartbeat listed on Enlisted, which lists 19 in total. Compare their pricing and features on each tool page.
- Are these Chartbeat alternatives free?
- All 13 are open source, so the code is free to use under its licence, and all of them can be self-hosted on your own server or computer. 10 also offer a paid or managed cloud version if you'd rather not host it yourself.
- How is this list of Chartbeat alternatives ranked?
- By a score built from GitHub stars, star growth over the last 30 days and how recently the code changed. 12 of these projects shipped code in the last 30 days. Data is refreshed daily, and nobody can pay to move up.
 TrackMedia
 TrackRev