7,380 open-source and SaaS tools, with GitHub stats refreshed every day.

5 alternatives ranked by real activity

Open-source Qlik alternatives

A curated, ranked list of the 5 best open-source alternatives to Qlik.

The best open-source alternative to Qlik is Superset. If that doesn't suit you, other good options are Saiku, DataLens, Datart and FlyFish.

Qlik alternatives are mainly BI & dashboard tools. 2 of them shipped code in the last 30 days, 5 can be self-hosted, and 4 use a permissive licence.

Last updated October 2, 2026 · ranked by GitHub stars, growth and recent commits

Superset

A web-based business intelligence platform from the Apache project with a no-code chart builder, SQL editor and dashboards that connects to most SQL databases.

GitHub stars
75k
Last commit
today
Latest release
6.1.0
Licence
Apache-2.0
Self-hosted
Yes
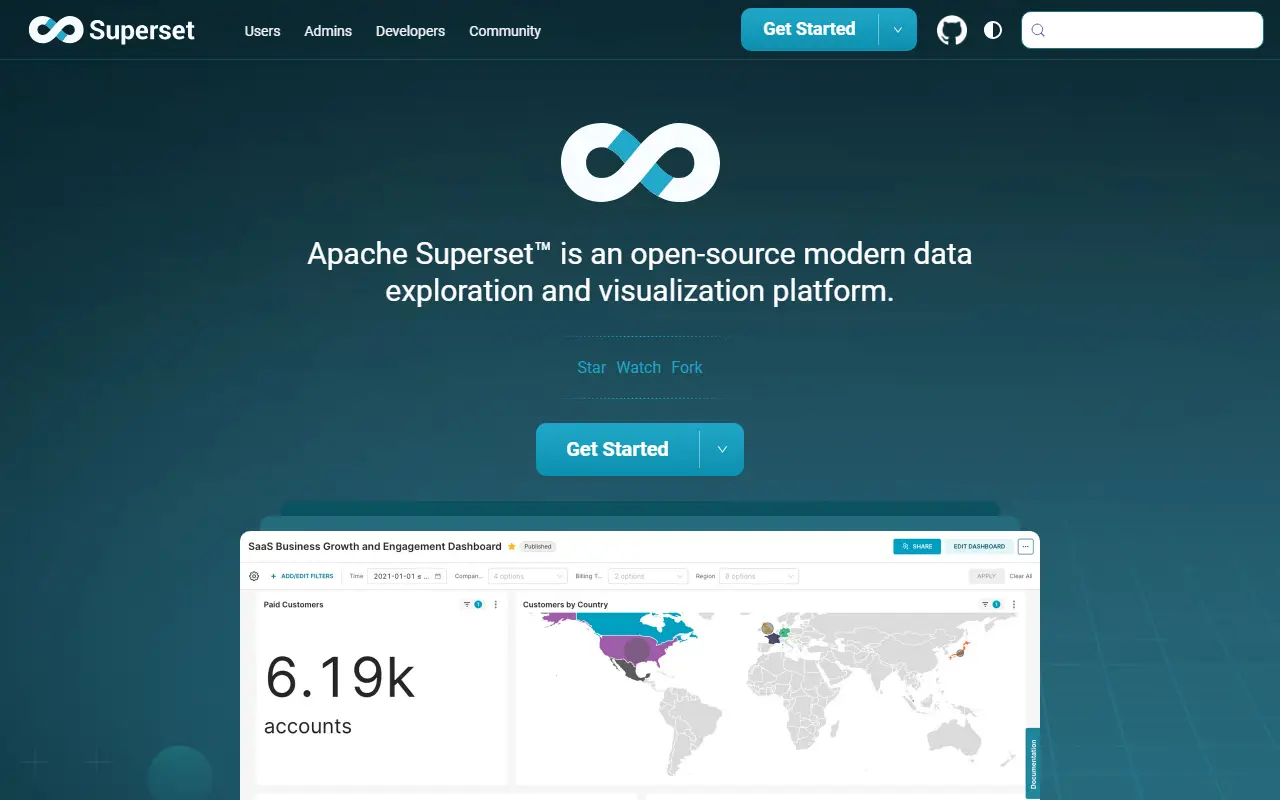
superset.apache.orgSuperset homepage screenshot

Apache Superset is a data exploration and visualization platform that runs as a web application. Analysts and business users can connect it to a database, build charts without code, assemble them into dashboards and share them, so it can augment or replace proprietary business intelligence tools for many teams.

The no-code chart builder sits next to a web-based SQL editor for advanced queries, and a lightweight semantic layer lets teams define reusable dimensions and metrics. Visualizations range from simple bar charts to geospatial views. Superset can query any SQL datastore or engine provided a matching Python database driver and SQLAlchemy dialect exist, including Presto, Trino and Athena. A configurable caching layer reduces database load, and security roles and authentication options are extensible.

The stack is Python with Flask on the back end and React on the front end, under the Apache-2.0 license. A REST API and extension framework allow programmatic control and customization. Documentation is split into guides for users, administrators and developers, and it is a typical choice for organizations that want a self-managed BI layer.

Key features

  • No-code chart builder
  • Web-based SQL editor
  • Shareable interactive dashboards
  • Lightweight semantic layer for metrics
  • Connects to any SQL database with a driver
  • Caching layer and security roles
  • REST API for programmatic customization

Pricing: Free and open source under the Apache-2.0 license.

Saiku

Saiku is an open-source semantic layer and OLAP analytics tool built on Mondrian and Apache Calcite, serving Excel, dashboards and AI agents.

GitHub stars
1.3k
Last commit
today
Latest release
v4.8.0
Licence
Apache-2.0
Self-hosted
Yes
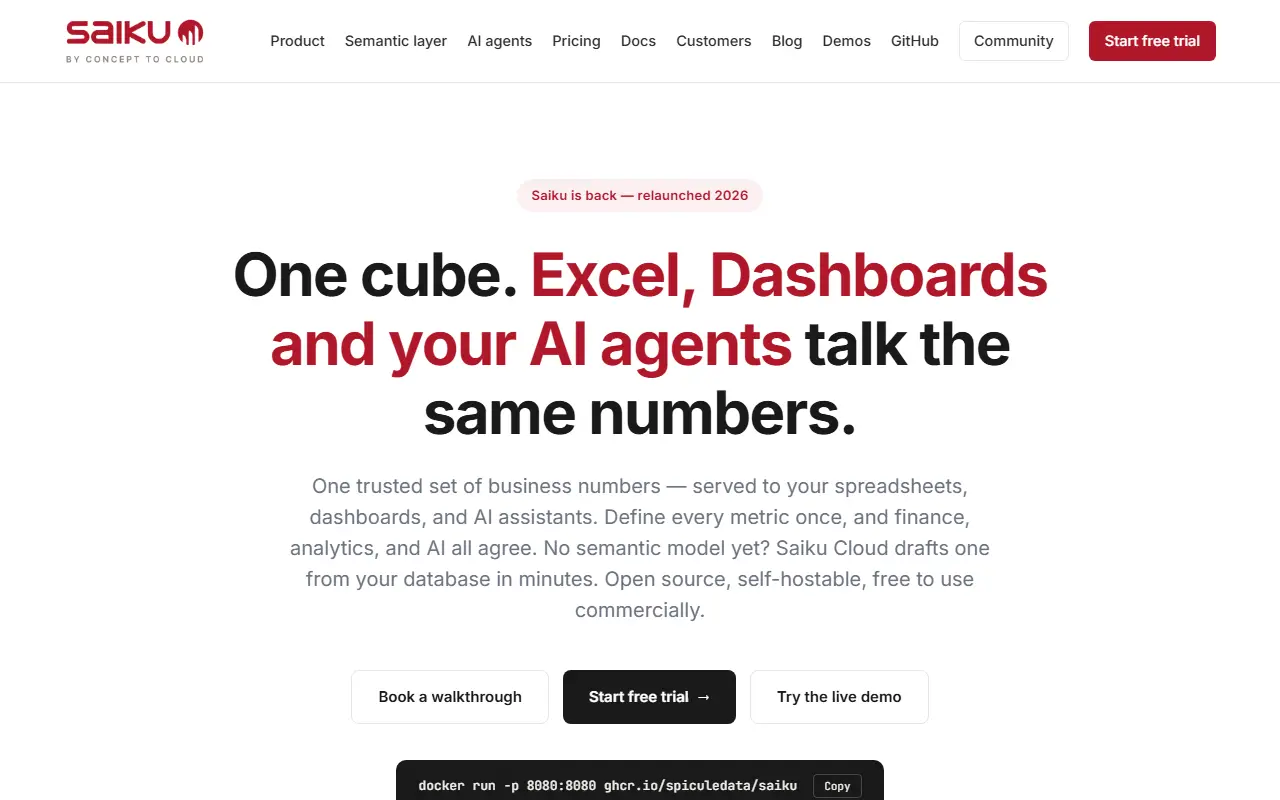
saiku.biSaiku homepage screenshot

Saiku began in 2010 as an open-source OLAP browser for Mondrian and was rebuilt in 2026 as a modern semantic layer for analytics. It defines business cubes once and then exposes them to different consumers: a drag-and-drop browser interface, Excel through MDX and XMLA, dashboards, and AI agents through MCP.

In the browser, users drag fields onto rows, columns and filters and the application writes MDX for them. The back end uses a fork of Mondrian 4.8 with an Apache Calcite-based SQL planner, which can reach modern engines such as lakehouse systems. A typed REST interface allows AI agents to query data without handling MDX. A demo mode ships with a self-contained H2 database and the FoodMart sample cube.

Saiku is written in Java and licensed under Apache-2.0. It runs from a Docker image, which runs as a non-root user and requires setting an admin password for real deployments, and a hosted demo instance resets nightly. It suits analytics and BI teams that need governed, reusable metric definitions across spreadsheets, dashboards and AI tools.

Key features

  • Drag-and-drop OLAP browser
  • MDX and XMLA access from Excel
  • Mondrian with Apache Calcite SQL planner
  • MCP and typed REST API for AI agents
  • Docker image with demo mode
  • Support for modern lakehouse engines

Pricing: Free and open source under the Apache-2.0 licence.

DataLens

DataLens is a business intelligence and data visualization system, developed at Yandex, that you can run on your own servers with Docker.

GitHub stars
1.7k
Last commit
1 mo ago
Latest release
v2.9.0
Licence
Apache-2.0
Self-hosted
Yes
Hosted version
Available
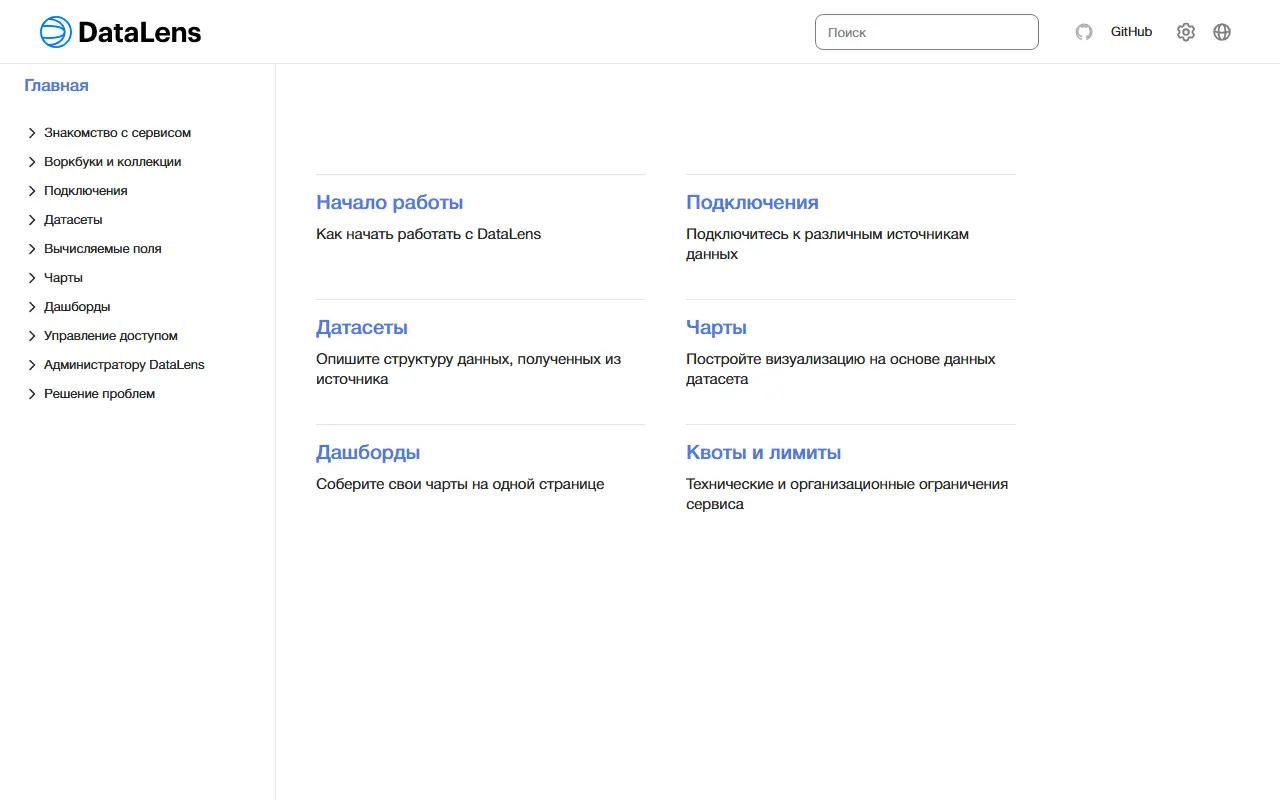
datalens.techDataLens homepage screenshot

DataLens is a modern business intelligence and data visualization system. It was developed and used extensively as a primary BI tool inside Yandex and is also offered as part of the Yandex Cloud platform, while the open-source version can be run independently.

Topics describe it as an analytics, dashboard, reporting and SQL visualization tool. The quick start needs Docker and the Docker Compose plugin; cloning the repository and running a start command launches all containers, and the UI is then available on port 8080, which can be changed with an environment variable. For production use the maintainers recommend generating a compose file with random secrets, which stores a generated admin password in the environment file.

Charts can use D3.js, or the proprietary Highcharts library if you enable it, in which case you must comply with Highcharts' own license. DataLens is licensed under Apache-2.0, has a roadmap, release notes and a Telegram community, and suits teams that want self-hosted dashboards.

Key features

  • Dashboards and data visualization
  • SQL-based datasets and charts
  • Docker Compose deployment
  • Generated secrets for production setups
  • D3.js charts with optional Highcharts
  • Also available in Yandex Cloud

Pricing: Free and open source under the Apache-2.0 license; a managed version is part of Yandex Cloud.

Datart

Datart is a free, Apache-licensed, open-source data visualization platform for building reports, dashboards and large-screen displays, created by the original Davinci BI team.

GitHub stars
2.3k
Last commit
1 yr ago
Licence
Apache-2.0
Self-hosted
Yes
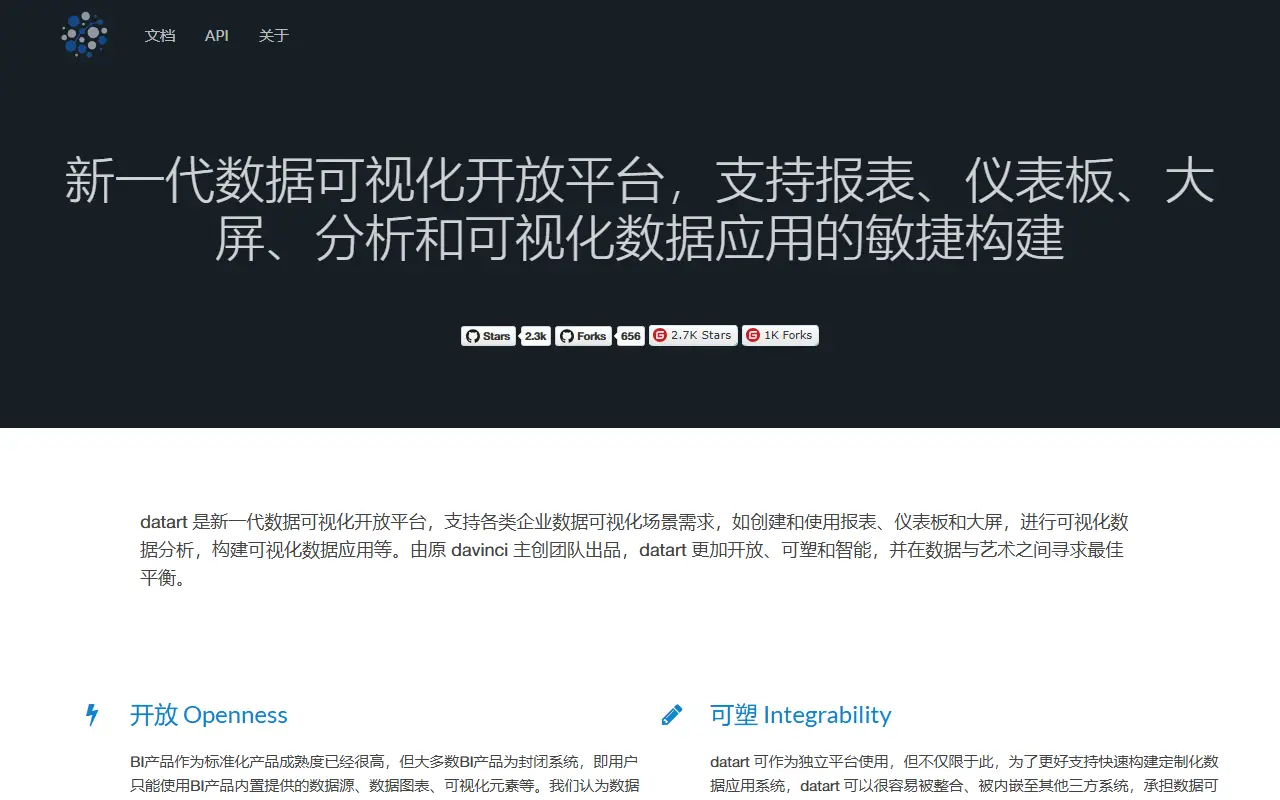
running-elephant.github.ioDatart homepage screenshot

Datart is a data visualization platform built by the original creators of the Davinci BI project, aimed at enterprises that need to build reports, dashboards, large-screen displays and visual data applications. It positions itself as more open, adaptable and intelligent than typical closed business intelligence products, where users are limited to built-in data sources and chart types.

The platform's design centers on three principles: openness, achieved through standardized processes for managed visualization apps, standardized interactions such as filtering, drilling and linking between charts, and pluggable extension points at the data source, chart and visualization layers; integrability, so Datart can be embedded into other systems using its login, permissions and SDK integration points rather than only used as a standalone platform; and augmented analytics, aiming to go beyond showing what happened in the data toward explaining why, through extensible analytical capabilities.

Datart is written in TypeScript and React and uses chart libraries including ECharts and D3. It is released under the Apache-2.0 license, with a public demo, deployment and quick-start guides, and an active community supported through issue tracking and a WeChat discussion group.

Key features

  • Reports, dashboards and large-screen visualizations
  • Pluggable data source, chart and visualization extensions
  • Standardized filtering, drilling and linking interactions
  • Embeddable via SDK into third-party systems
  • SQL editor for data queries
  • ECharts and D3-based charting

Pricing: Free and open source under the Apache-2.0 license.
FlyFish

FlyFish is a drag-and-drop data visualization platform from Cloudwise for building dashboards and big-screen apps from reusable components and data sources.

GitHub stars
964
Last commit
2 yr ago
Latest release
FlyFish-3.0.0
Licence
GPL-3.0
Self-hosted
Yes

FlyFish, from Cloudwise, is a data visualization coding platform. Users create a data model in a simple way and then assemble a set of visualization solutions by dragging components, with the aim of producing dashboards and large-screen displays quickly. The project is open source under GPL-3.0.

The platform is organized around projects, which represent a business scenario and group several applications and components. Developers can build single-page or multi-page large-screen applications, develop individual components as the smallest building blocks, and upload finished apps or components to a template library to start new projects faster. Data sources such as MySQL and HTTP can be connected, and SQL queries can shape the data that components consume.

For deployment, the README recommends Docker and lists the ports used by the MySQL, web, online code editor, main backend and data source services; manual installation guides are also provided. A demo environment, a template center, technical documentation, teaching videos and a Gitee mirror are linked. It suits teams building analytics screens.

Key features

  • Drag-and-drop visualization building
  • Single-page and multi-page large-screen apps
  • Component development as reusable units
  • Template library for apps and components
  • Data source management for MySQL and HTTP
  • SQL queries to shape component data

Pricing: Open source under GPL-3.0.

Qlik alternatives: questions

What is the best open-source alternative to Qlik?
Superset is the top-ranked open-source alternative to Qlik on Enlisted: A web-based business intelligence platform from the Apache project with a no-code chart builder, SQL editor and dashboards that connects to most SQL databases. Other strong options are Saiku, DataLens, Datart and FlyFish.
Are these Qlik alternatives free?
All 5 are open source, so the code is free to use under its licence, and all of them can be self-hosted on your own server or computer. 1 also offers a paid or managed cloud version if you'd rather not host it yourself.
How is this list of Qlik alternatives ranked?
By a score built from GitHub stars, star growth over the last 30 days and how recently the code changed. 2 of these projects shipped code in the last 30 days. Data is refreshed daily, and nobody can pay to move up.

People also look for alternatives to…

View all