Chartbrew
Chartbrew is an open-source reporting platform that turns data from APIs, SQL and NoSQL databases into live dashboards and embeddable charts.
- GitHub stars
- 4.1k
- Last commit
- 3 days ago
- Latest release
- v5.3.2
- Self-hosted
- Yes
- Hosted version
- Available
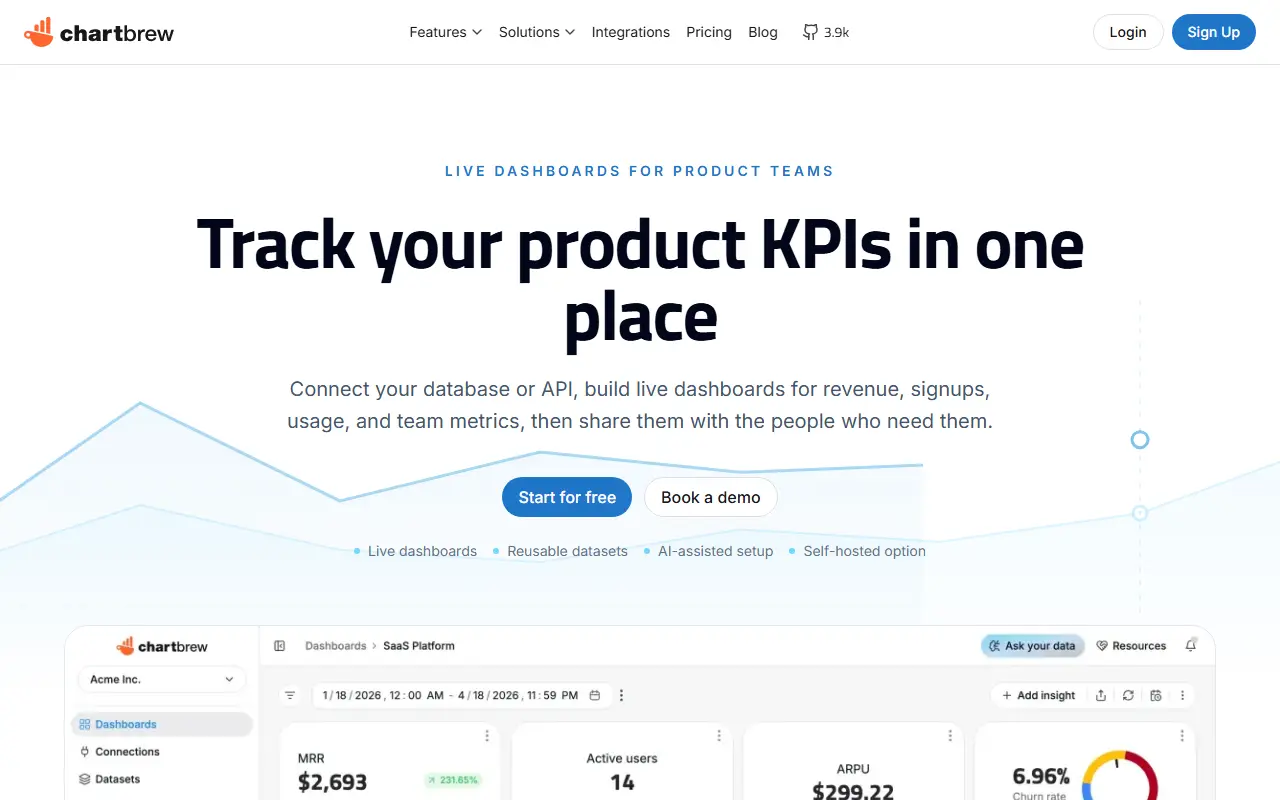
Chartbrew is an open-source web application that connects directly to databases and APIs and uses the data to build charts and dashboards. Its tools include a chart builder, editable dashboards, embeddable charts, a query and request editor and team features for sharing reports.
The platform also includes an AI assistant and scheduling, and its topics reference MySQL, PostgreSQL, MongoDB, Firestore and Firebase as data sources, with the latest list of supported sources on the project website. To self-host, the README lists Node.js 22 or newer, MySQL 5 or PostgreSQL 12.5 or newer, and Redis 6 or newer as prerequisites. The front end uses React and the back end Node.js.
A hosted Chartbrew service is available, and the repository license is listed as 'Other' on GitHub, so check the terms for your use. Chartbrew suits agencies, startups and teams who want shareable client dashboards without building a BI stack.
Key features
- Chart builder and editable dashboards
- Connects to APIs, SQL and NoSQL data
- Charts that can be embedded
- Query and request editor
- AI assistant and scheduling
- Team collaboration features
Pricing: No free cloud plan, but there is a 14-day trial and a free self-hosted option. Starter is $29, Growth $99 and Professional $299 per month, cheaper billed yearly; Enterprise is custom.