
About Telegraf
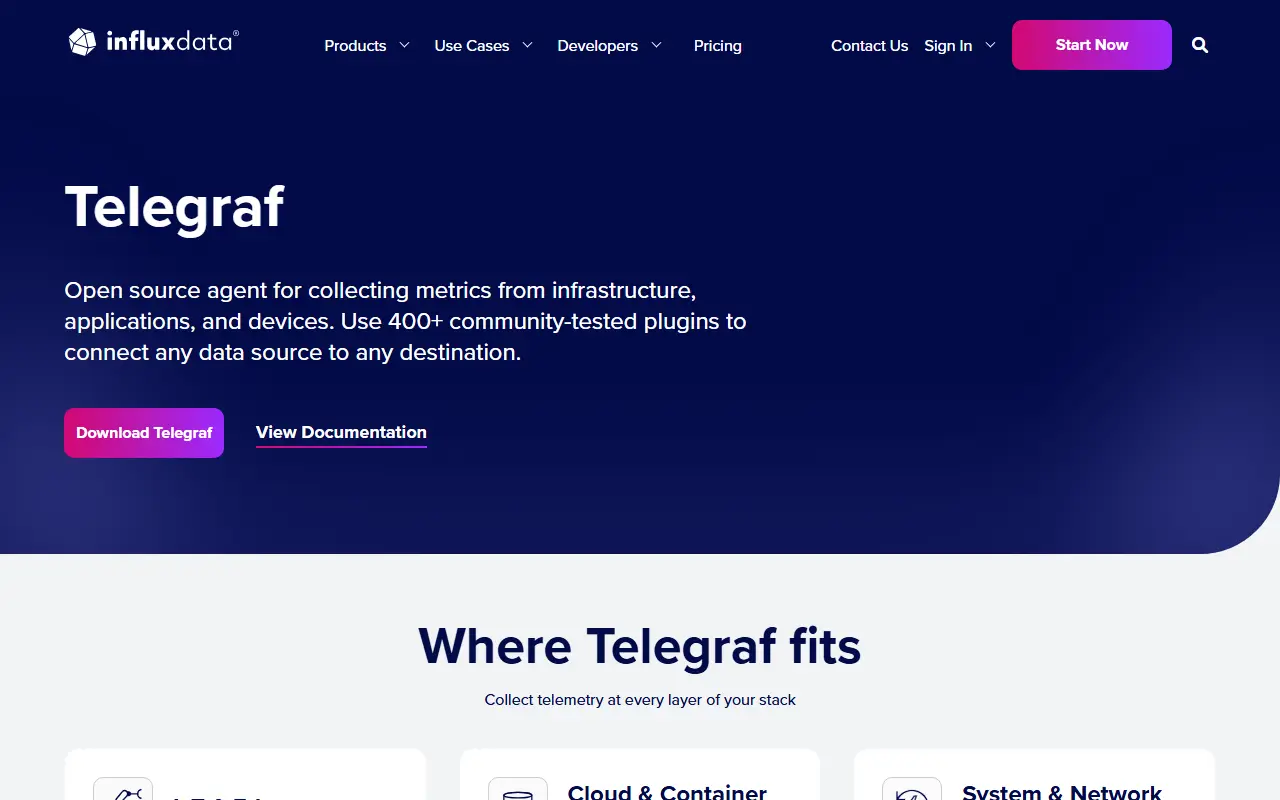
Telegraf is an agent for gathering, processing, aggregating and writing metrics, logs and other kinds of data. It comes from InfluxData and is commonly paired with InfluxDB, but it can write to many other destinations, so it works as a general-purpose collector in monitoring pipelines.
Its strength is a library of more than 300 plugins that cover devices such as OPC UA and Modbus, logs from files and directories, messaging systems like AMQP, Kafka and MQTT, monitoring standards such as OpenTelemetry and Prometheus, networking gear, and system metrics for CPU, memory, disk, network, S.M.A.R.T., Docker and Nvidia GPUs. Universal plugins like Exec and HTTP let you run your own code to collect or transform data. Telegraf compiles to a standalone static binary with no external dependencies, and it is configured in TOML.
The project, written in Go and MIT licensed, has more than a thousand contributors. It is run on the machines you want to monitor, and suits sysadmins, IoT engineers and observability teams that want one flexible agent instead of many specialized exporters.
Key features
- 300+ input, processor and output plugins
- Static binary with no dependencies
- Configuration written in TOML
- Custom collection through exec plugins
- System, Docker and GPU metrics
- Support for Kafka, MQTT and OpenTelemetry
Good fit for
- →Collecting server and container metrics
- →Industrial and IoT data ingestion
- →Forwarding logs and metrics to time series stores
- Built with
- Go
- Tags
- metrics
- monitoring
- agent
- plugins
- golang
- influxdb
- iot
- observability
- telegraf
Telegraf: questions and answers
- What is Telegraf used for?
- Telegraf is a plugin-driven agent that collects, processes and forwards metrics, logs and other data, shipping as a single static Go binary with TOML configuration. It is a good fit for collecting server and container metrics, industrial and IoT data ingestion, and forwarding logs and metrics to time series stores.
- Is Telegraf open source?
- Yes. Telegraf is open source under the MIT licence. Its source code is on GitHub at influxdata/telegraf and is written mainly in Go.
- Is Telegraf free?
- Yes. Telegraf is open source, so the software itself is free to use. Paid plans are also available, starting at $18,000 per year.
- Can I self-host Telegraf?
- Yes. Telegraf can be self-hosted on your own server or infrastructure; there is no official hosted version.
- What is Telegraf an alternative to?
- Telegraf is an open-source alternative to Cribl and Mezmo. Other open-source alternatives to Cribl include Vector, OpenTelemetry Collector and Grafana Alloy.
- Is Telegraf actively maintained?
- Yes. The most recent commit to Telegraf was on 1 October 2026, and the latest release is v1.40.1, published on 21 September 2026. The project has 18k stars on GitHub.
Open-source alternatives to Telegraf
See all
Vector
Monitoring & Observability
A high-performance observability data pipeline.
MPL-2.0vs Cribl★ 23k
OpenTelemetry Collector
Monitoring & Observability
OpenTelemetry Collector
Apache-2.0vs Cribl★ 7.6k
Grafana Alloy
Monitoring & Observability
OpenTelemetry Collector distribution with programmable pipelines
Apache-2.0vs Cribl★ 3.6k
Logstash
Data Pipelines & ETL
Logstash - transport and process your logs, events, or other data
OSSvs Cribl★ 15k
Grafana Loki
Monitoring & Observability
Like Prometheus, but for logs.
AGPL-3.0vs Datadog★ 29k
OpenObserve
Monitoring & Observability
High-performance, unified observability for the AI era. 140x lower storage cost.
AGPL-3.0vs Datadog★ 22k
SaaS alternatives to Telegraf
See all
Cribl
Monitoring & Observability
Telemetry pipeline that routes, reduces and enriches logs and metrics
SaaS
Mezmo
Monitoring & Observability
Telemetry pipeline and log analysis platform
SaaS
Amazon CloudWatch
Monitoring & Observability
AWS service for metrics, logs, alarms and dashboards
SaaS
Azure Monitor
Monitoring & Observability
Azure service for collecting and analyzing metrics, logs and traces
SaaS
Coralogix
Monitoring & Observability
Observability platform that analyzes logs, metrics and traces as they are ingested
SaaS
AppDynamics
Monitoring & Observability
Cisco application performance monitoring that maps technical metrics to business impact
SaaS