7,363 open-source and SaaS tools, with GitHub stats refreshed every day.

5 alternatives ranked by real activity

Open-source Cribl alternatives

A curated, ranked list of the 5 best open-source alternatives to Cribl.

The best open-source alternative to Cribl is Vector. If that doesn't suit you, other good options are Telegraf, Logstash, OpenTelemetry Collector and Grafana Alloy.

Cribl alternatives are mainly monitoring & observability tools, but some are also data pipeline & ETL tools. 5 of them shipped code in the last 30 days, 5 can be self-hosted, and 4 use a permissive licence.

Last updated October 2, 2026 · ranked by GitHub stars, growth and recent commits

Vector

A Rust-based observability data pipeline from Datadog's open-source team that collects, transforms and routes logs and metrics to any destination.

GitHub stars
23k
Last commit
yesterday
Latest release
vdev-v0.3.25
Licence
MPL-2.0
Self-hosted
Yes

Vector is a high-performance observability data pipeline that works both as an agent and as an aggregator. It collects logs and metrics from many sources, transforms them, and routes them to whichever vendors or storage systems you choose, so you can switch or combine backends without changing how data is collected.

The project argues that this gives you control over your telemetry: you can cut costs by filtering and shaping data before it reaches a paid vendor, enrich events in new ways and apply data security where you need it rather than where it is most convenient for a vendor. It also claims to be substantially faster than comparable tools. Built in Rust, its primary design goal is reliability, and topics mention traces, stream processing and ETL.

Datadog's open-source engineering team maintains Vector, which is licensed under MPL-2.0. The README offers a quickstart, installation guides, integrations and container images. Because it is software you run yourself, it needs no hosted service, and it suits platform and SRE teams that manage large volumes of logs and metrics.

Key features

  • Collects logs and metrics from many sources
  • Transforms and enriches events in flight
  • Routes data to multiple destinations
  • Runs as agent or aggregator
  • Written in Rust for reliability
  • Container images and install guides

Pricing: Free and open source under the MPL-2.0 license.

Telegraf

Telegraf is a plugin-driven agent that collects, processes and forwards metrics, logs and other data, shipping as a single static Go binary with TOML configuration.

GitHub stars
18k
Last commit
yesterday
Latest release
v1.40.1
Licence
MIT
Self-hosted
Yes
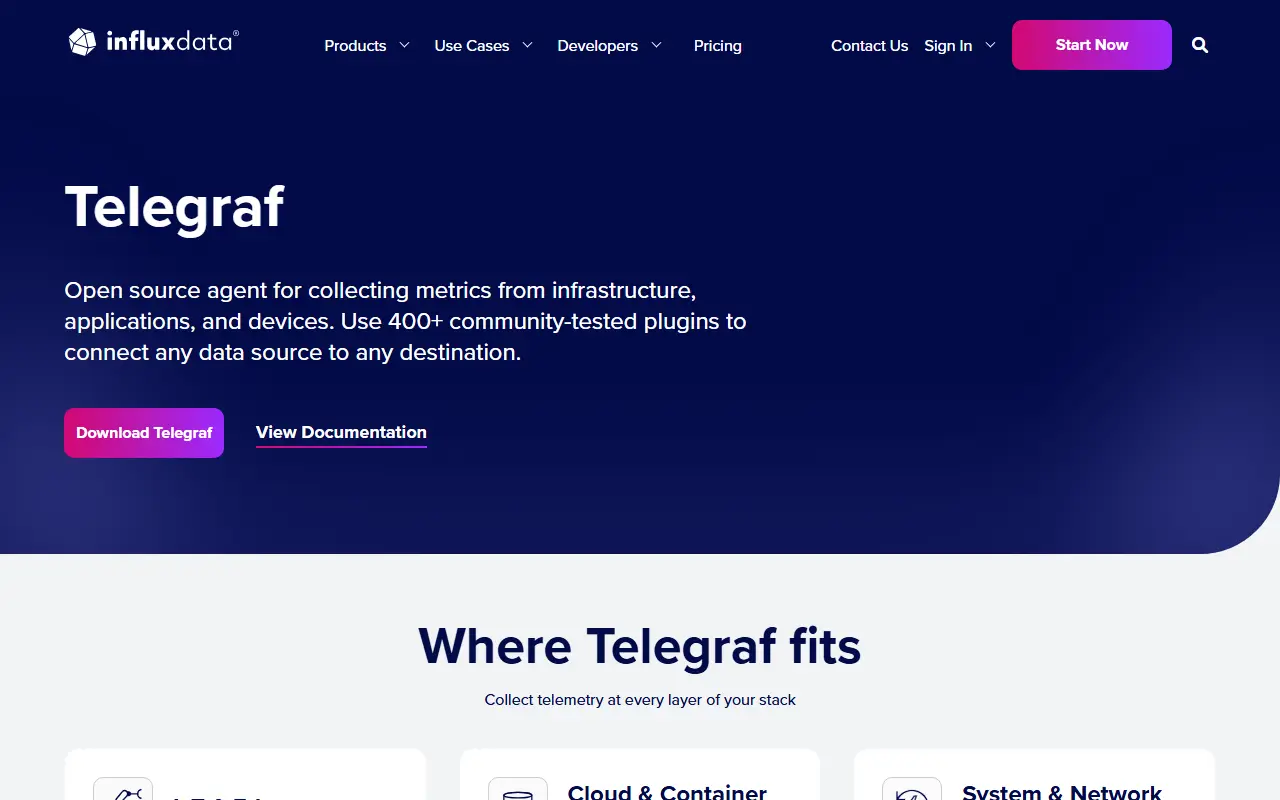
influxdata.comTelegraf homepage screenshot

Telegraf is an agent for gathering, processing, aggregating and writing metrics, logs and other kinds of data. It comes from InfluxData and is commonly paired with InfluxDB, but it can write to many other destinations, so it works as a general-purpose collector in monitoring pipelines.

Its strength is a library of more than 300 plugins that cover devices such as OPC UA and Modbus, logs from files and directories, messaging systems like AMQP, Kafka and MQTT, monitoring standards such as OpenTelemetry and Prometheus, networking gear, and system metrics for CPU, memory, disk, network, S.M.A.R.T., Docker and Nvidia GPUs. Universal plugins like Exec and HTTP let you run your own code to collect or transform data. Telegraf compiles to a standalone static binary with no external dependencies, and it is configured in TOML.

The project, written in Go and MIT licensed, has more than a thousand contributors. It is run on the machines you want to monitor, and suits sysadmins, IoT engineers and observability teams that want one flexible agent instead of many specialized exporters.

Key features

  • 300+ input, processor and output plugins
  • Static binary with no dependencies
  • Configuration written in TOML
  • Custom collection through exec plugins
  • System, Docker and GPU metrics
  • Support for Kafka, MQTT and OpenTelemetry

Pricing: The Telegraf agent is open source and free to run yourself. Telegraf Enterprise has custom pricing with plans starting at $18,000 per year.

Logstash

Logstash is a server-side data processing pipeline that ingests data from many sources, transforms it and sends it to destinations such as Elasticsearch.

GitHub stars
15k
Last commit
yesterday
Latest release
v9.5.4
Self-hosted
Yes
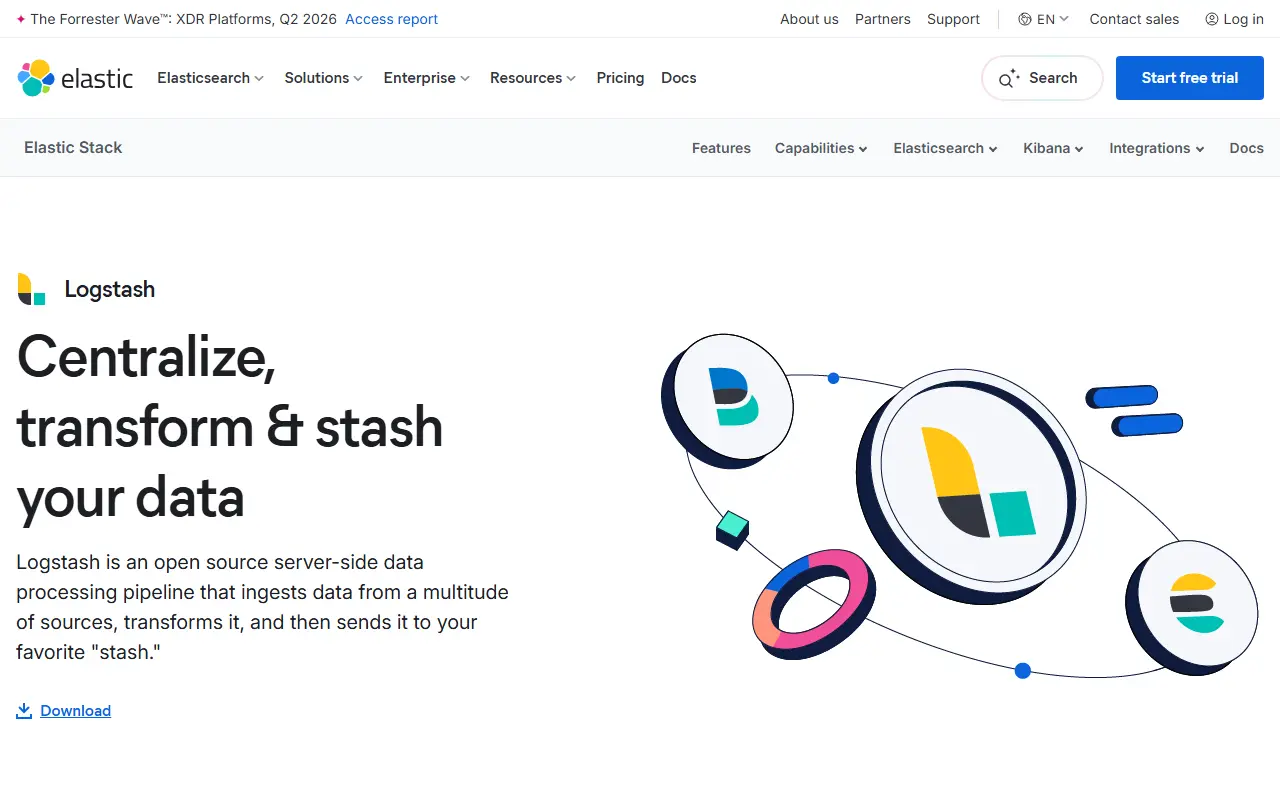
elastic.coLogstash homepage screenshot

Logstash is part of the Elastic Stack alongside Beats, Elasticsearch and Kibana. It is a server-side data processing pipeline that ingests data from many sources at once, transforms it, and then ships it to a storage destination, with Elasticsearch being the natural target in Elastic's own stack. It is built with Java and JRuby.

Its functionality comes from plugins. The project says Logstash has over 200 plugins, hosted in separate repositories under the logstash-plugins GitHub organization, and each plugin is a self-contained Ruby gem published to RubyGems.org. Writing your own plugin is described as easy, with documentation on developing and testing them.

Official binaries and Debian and RPM packages are available from the downloads page, and documentation, a forum and Elastic support channels are listed. Development of the core requires JDK 21. The repository lists the license as 'Other', so the license files should be reviewed for exact terms.

Key features

  • Ingests data from many sources at once
  • Transforms and enriches events in a pipeline
  • Over 200 plugins
  • Plugins distributed as Ruby gems
  • Debian and RPM packages
  • Part of the Elastic Stack

OpenTelemetry Collector

The OpenTelemetry Collector is a vendor-agnostic service that receives, processes and exports traces, metrics and logs so one agent can feed many observability back-ends.

GitHub stars
7.6k
Last commit
yesterday
Latest release
v0.162.0
Licence
Apache-2.0
Self-hosted
Yes
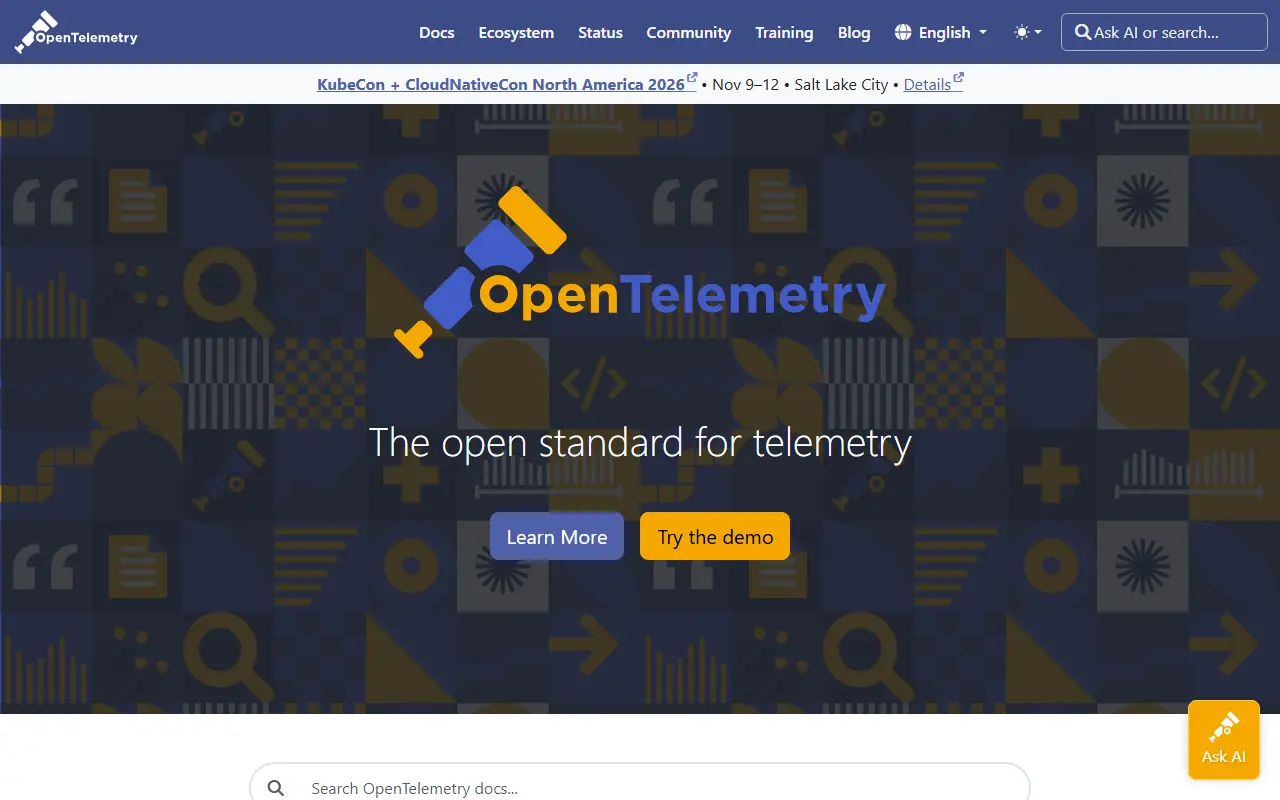
opentelemetry.ioOpenTelemetry Collector homepage screenshot

This entry covers the OpenTelemetry Collector, the component of the OpenTelemetry project that handles telemetry data in transit. It is a vendor-agnostic implementation for receiving, processing and exporting telemetry, so teams do not need to run separate agents or collectors for each open-source telemetry format such as Jaeger or Prometheus when sending data to several open-source or commercial back-ends.

The project's stated objectives are to be usable, with sensible default configuration and support for popular protocols, performant and stable under varying loads, observable itself, extensible without touching the core code, and unified, with a single codebase that can run as an agent or a collector for traces, metrics and logs. Documentation covers getting started, configuration, security and monitoring.

The Collector is written in Go, licensed under Apache-2.0 and is part of the CNCF ecosystem, with a special interest group that meets weekly. You deploy it yourself next to your applications or as a central gateway. It suits platform and SRE teams standardizing telemetry pipelines.

Key features

  • Receives telemetry in many protocols
  • Processes and transforms traces, metrics and logs
  • Exports to open-source and commercial back-ends
  • Runs as an agent or a gateway
  • Extensible through components
  • Sensible default configuration

Pricing: Free and open source under the Apache-2.0 licence.

Grafana Alloy

Grafana Alloy is an OpenTelemetry Collector distribution with programmable pipelines for collecting metrics, logs, traces and profiles.

GitHub stars
3.6k
Last commit
yesterday
Latest release
v1.20.1
Licence
Apache-2.0
Self-hosted
Yes
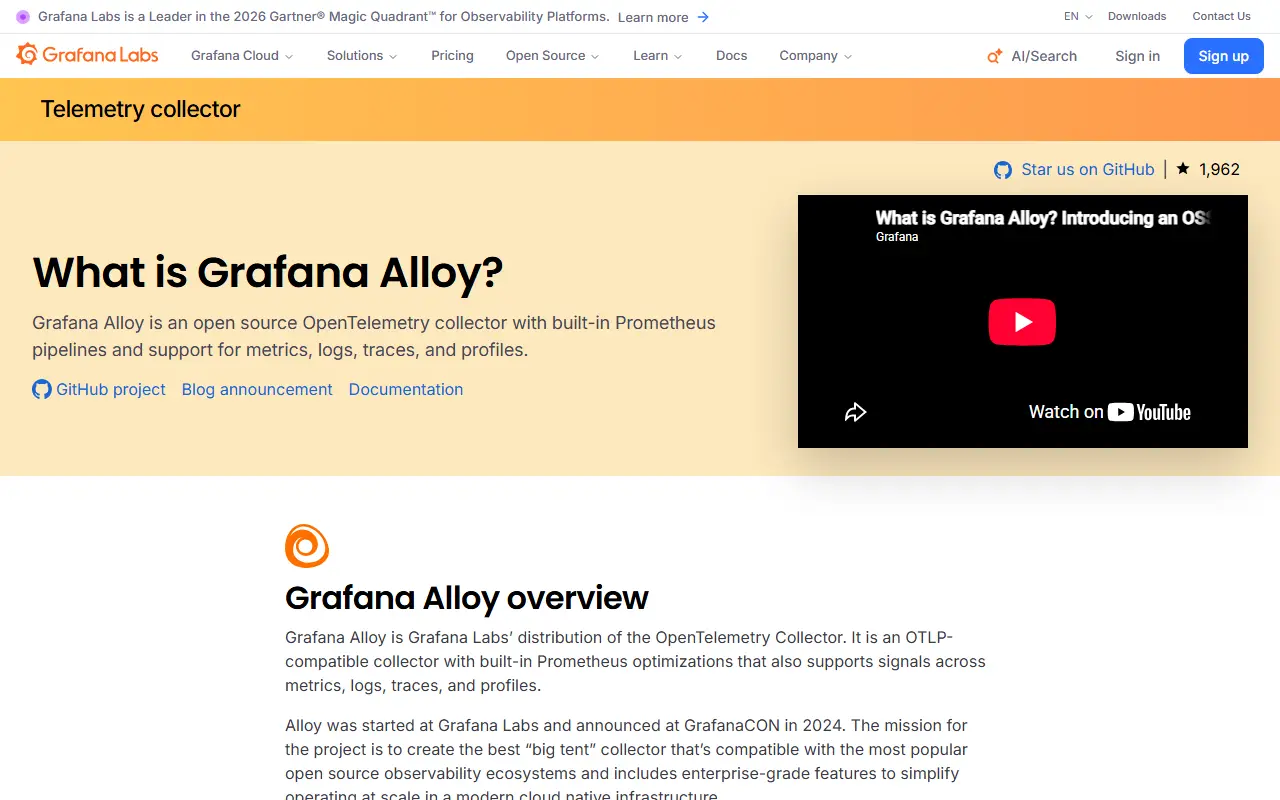
grafana.comGrafana Alloy homepage screenshot

Grafana Alloy is an open-source distribution of the OpenTelemetry Collector with built-in Prometheus pipelines. It collects and forwards metrics, logs, traces and profiles, serving as the telemetry agent in many Grafana-based setups while staying vendor-neutral.

Its main differentiators, per the README, are programmable pipelines configured with an expression-based syntax, support for dozens of OpenTelemetry Collector components alongside new Alloy-specific components, and a big tent philosophy under which it works with other vendors and open-source databases. Topics mention Loki and Prometheus. It is written in Go.

Alloy is licensed under Apache-2.0 and you run it yourself on hosts or in Kubernetes, sending data to Grafana Cloud or any compatible back end. It suits platform and SRE teams that want one configurable collector for all telemetry signals.

Key features

  • OpenTelemetry Collector distribution
  • Built-in Prometheus pipelines
  • Metrics, logs, traces and profiles
  • Programmable expression-based pipelines
  • Works with non-Grafana back ends
  • Runs on hosts and Kubernetes

Pricing: Free plan with usage limits and no credit card required. Pro costs from $19/month plus usage-based pricing for services. Enterprise requires $25,000 minimum annual commitment.

Cribl alternatives: questions

What is the best open-source alternative to Cribl?
Vector is the top-ranked open-source alternative to Cribl on Enlisted: A Rust-based observability data pipeline from Datadog's open-source team that collects, transforms and routes logs and metrics to any destination. Other strong options are Telegraf, Logstash, OpenTelemetry Collector and Grafana Alloy.
Are these Cribl alternatives free?
All 5 are open source, so the code is free to use under its licence, and all of them can be self-hosted on your own server or computer.
How is this list of Cribl alternatives ranked?
By a score built from GitHub stars, star growth over the last 30 days and how recently the code changed. 5 of these projects shipped code in the last 30 days. Data is refreshed daily, and nobody can pay to move up.

People also look for alternatives to…

View all