
About Tailstream
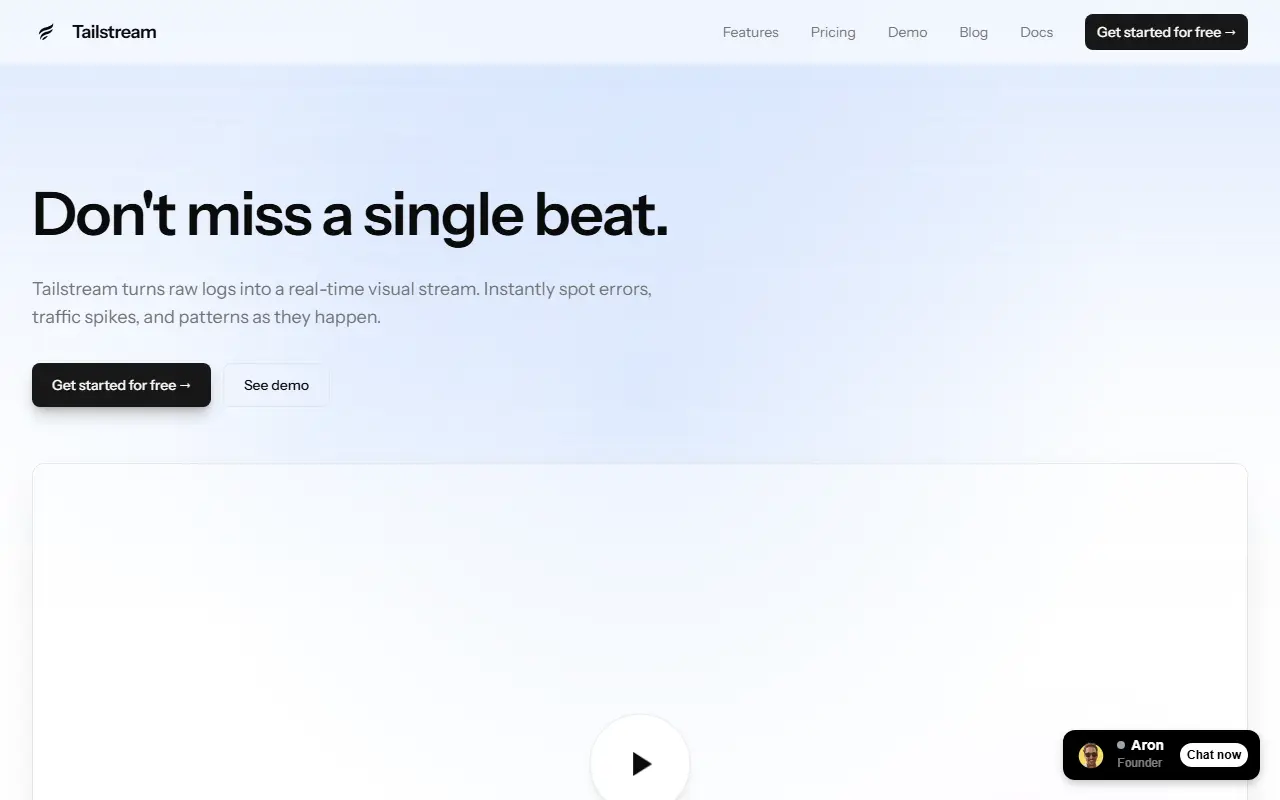
Tailstream replaces scrolling text logs with a live visual stream. In the demo, each HTTP request appears as a particle whose size reflects response size, speed reflects response time and color reflects status code, so spikes and anomalies stand out, and 4xx and 5xx errors are emphasized so incidents do not hide among successful requests. Supported sources include nginx, Apache, Kubernetes and generic JSON logs.
Setup is one curl command that installs an agent. Several visual themes, from particle flows to arcade-style layouts and classic streams, and a wallboard mode for network operations screens and incident rooms are offered, and past traffic can be replayed to see what led to current behavior. The architecture uses Redis Streams and TimescaleDB for ingest and replay. The free plan includes 100,000 events a month, one stream and 24-hour retention, and Starter at $29 a month raises this to 1 million events, three streams and 7-day retention.
Key features
- Real-time particle visualization of logs
- Errors emphasized by status code
- Works with nginx, Apache, Kubernetes and JSON logs
- Multiple visual themes
- Wallboard mode for incident rooms
- Replay of past events
Good fit for
- Watching live traffic on a wall display
- Spotting error spikes as they happen
- Replaying the minutes before an incident
Tailstream: questions and answers
- What is Tailstream used for?
- Tailstream is a log visualization tool that turns server logs into a real-time visual stream with replay, installed with a single agent command. It is a good fit for watching live traffic on a wall display, spotting error spikes as they happen and replaying the minutes before an incident.
- Is Tailstream free?
- Yes. Tailstream has a free plan, and paid plans start at $29 per month.
- Is Tailstream open source?
- No. Tailstream is proprietary (closed-source) software and can't be self-hosted. In the Monitoring & Observability category, open-source options include Netdata, Prometheus Operator and Sloth.
- What are some alternatives to Tailstream?
- Tailstream competes with Papertrail, Better Stack and Mezmo.
Open-source alternatives to Tailstream
See all
Netdata
Monitoring & Observability
The fastest path to AI-powered full stack observability, even for lean teams.
GPL-3.0vs Datadog★ 81k
Prometheus Operator
Monitoring & Observability
Prometheus Operator creates/configures/manages Prometheus clusters atop Kubernetes
Apache-2.0★ 10k
Sloth
Monitoring & Observability
🦥 Easy and simple Prometheus SLO (service level objectives) generator
Apache-2.0★ 2.6k
Prometheus
Monitoring & Observability
The Prometheus monitoring system and time series database.
Apache-2.0vs Datadog★ 66k
Sentry
Monitoring & Observability
Developer-first error tracking and performance monitoring
OSSvs Rollbar★ 45k
Grafana Loki
Monitoring & Observability
Like Prometheus, but for logs.
AGPL-3.0vs Datadog★ 29k
SaaS alternatives to Tailstream
See all
Papertrail
Monitoring & Observability
Hosted log aggregation with live tail and search, from SolarWinds
SaaS
Better Stack
Monitoring & Observability
Uptime monitoring, on-call alerts, status pages and log management in one product
SaaS
Mezmo
Monitoring & Observability
Telemetry pipeline and log analysis platform
SaaS
Axiom
Monitoring & Observability
Cloud service for ingesting, storing and querying logs, traces and event data
SaaS
Loggly
Monitoring & Observability
Cloud log management with search, dashboards and alerting
SaaS
Logier
Monitoring & Observability
Log analysis tool that parses any log format, clusters duplicate errors and surfaces root causes
SaaS