7,363 open-source and SaaS tools, with GitHub stats refreshed every day.

13 alternatives ranked by real activity

Open-source UptimeRobot alternatives

A curated, ranked list of the 13 best open-source alternatives to UptimeRobot.

The best open-source alternative to UptimeRobot is Uptime Kuma. If that doesn't suit you, other good options are Upptime, Gatus, Checkmate and Nezha.

UptimeRobot alternatives are mainly monitoring & observability tools, but some are also analytics tools. 7 of them shipped code in the last 30 days, 13 can be self-hosted, and 9 use a permissive licence.

Last updated October 2, 2026 · ranked by GitHub stars, growth and recent commits

Uptime Kuma

A self-hosted monitoring tool that checks websites, ports, DNS and containers, sends alerts through many notification services and publishes status pages.

GitHub stars
92k
Last commit
yesterday
Latest release
2.5.5
Licence
MIT
Self-hosted
Yes
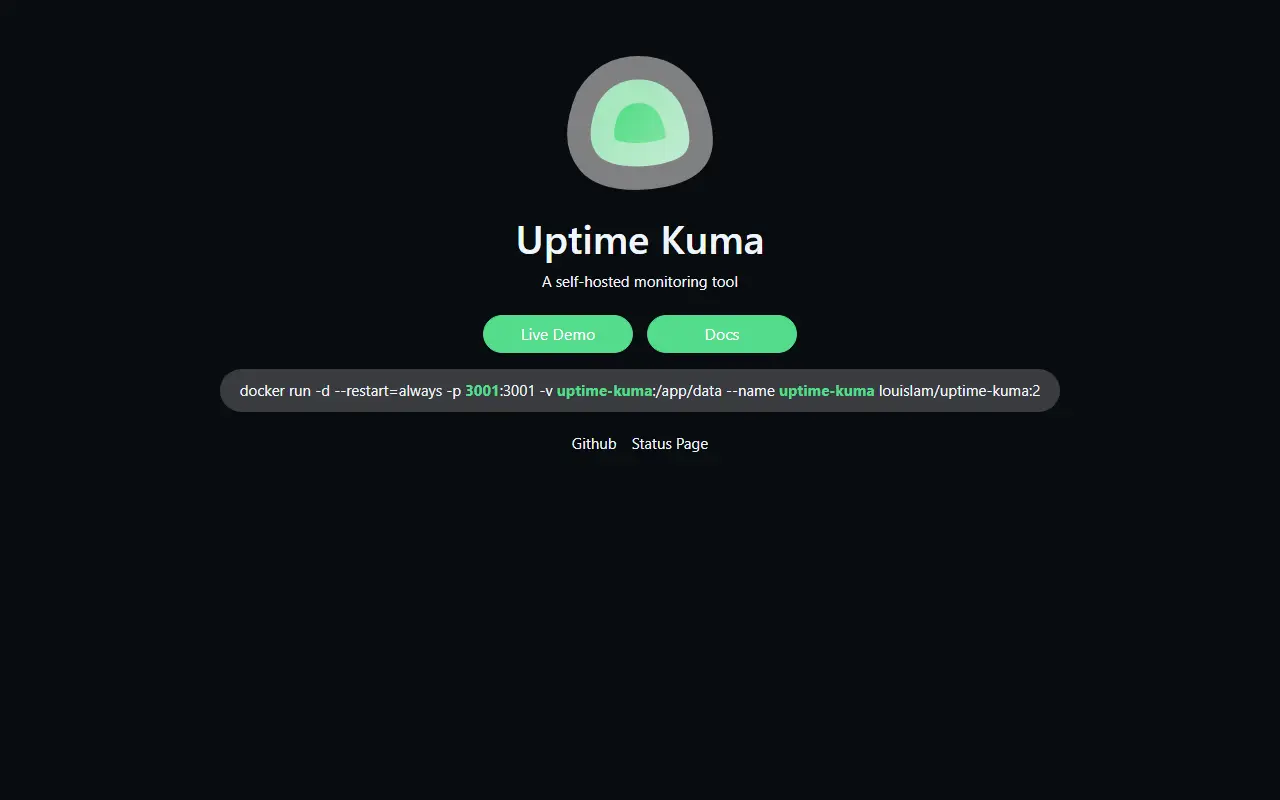
uptime.kuma.petUptime Kuma homepage screenshot

Uptime Kuma is a self-hosted tool that watches whether your services are up and tells you when they are not. You run it on your own server, point it at the endpoints you care about, and it records response times, certificate details and outages in a responsive web dashboard.

Supported monitor types include HTTP(S), TCP, keyword and JSON query checks, WebSocket, ping, DNS records, push-based heartbeats, Steam game servers and Docker containers, with checks as frequent as every 20 seconds. Alerts can go to Telegram, Discord, Gotify, Slack, Pushover, email over SMTP and more than 90 other notification services. You can publish several status pages and map them to your own domains.

It is MIT licensed and mainly distributed as a Docker image, with a Docker Compose setup and a non-Docker route that uses Node.js and pm2. Extras include proxy support, two-factor authentication, multiple UI languages and ping charts. Network file systems such as NFS are not supported for its data directory.

Key features

  • Monitors HTTP, TCP, DNS, ping and Docker containers
  • Checks as often as every 20 seconds
  • Alerts through 90+ notification services
  • Multiple status pages on custom domains
  • Certificate details and ping charts
  • Two-factor authentication and proxy support

Pricing: Free and open source under the MIT license; you host it yourself.

Upptime

Upptime is an open-source uptime monitor and status page that runs entirely on GitHub Actions, Issues and Pages.

GitHub stars
17k
Last commit
yesterday
Latest release
v2.0.0
Licence
MIT
Self-hosted
Yes
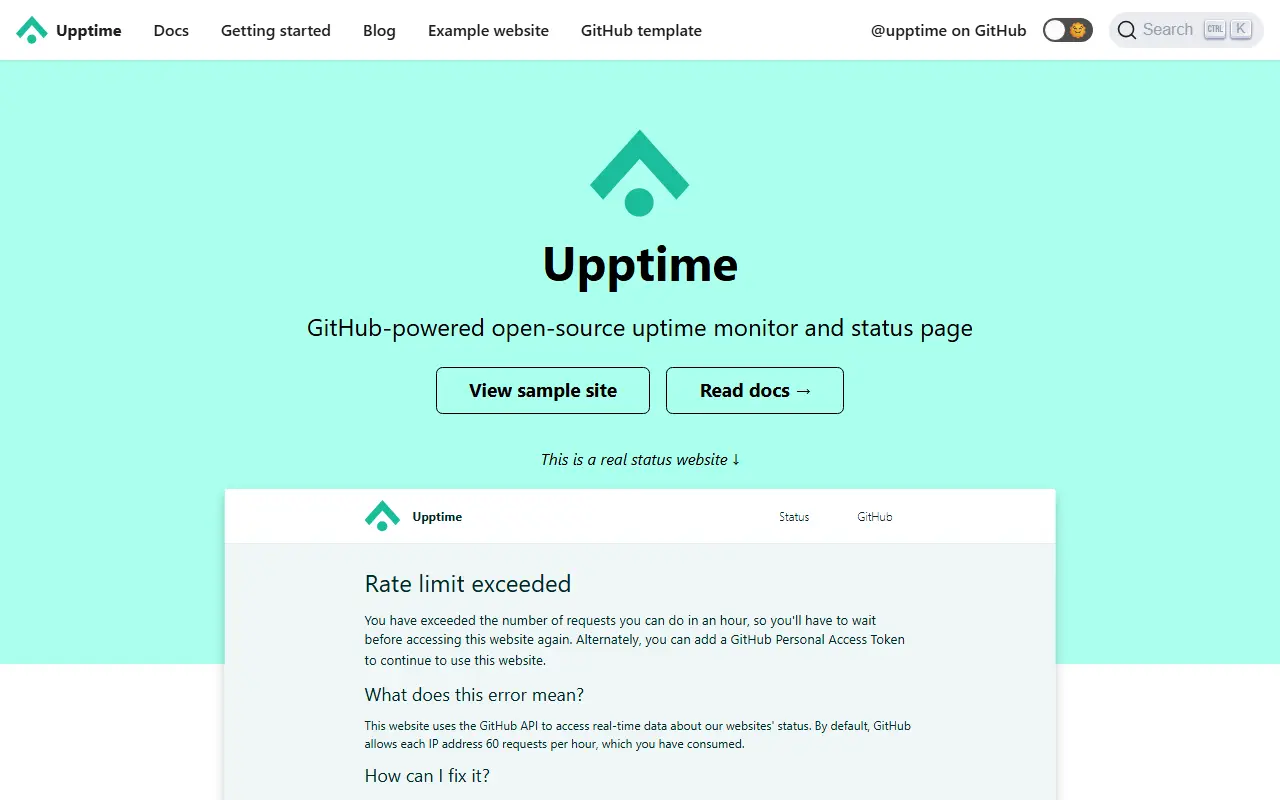
upptime.js.orgUpptime homepage screenshot

Upptime is an uptime monitor and status page that runs entirely on GitHub Actions, GitHub Issues and GitHub Pages, so no separate server is needed. Scheduled workflow runs check your endpoints as often as every five minutes and record response times by committing the data to git.

When downtime is detected, GitHub Issues are opened and closed automatically to track incidents. A status page built with Svelte is published through GitHub Pages and displays uptime, response times and incident history. Configuration lives in a single file, and every change and event leaves an audit trail in the git history.

The project is MIT licensed and was created by Anand Chowdhary as an affordable, flexible monitor that he could control himself. It costs nothing extra for anyone already using GitHub, because there is no subscription or external server. Deleting the repository also removes the data, since all history is stored in it.

Key features

  • Scheduled uptime checks via GitHub Actions
  • Response time history committed to git
  • Automatic incident issues on downtime
  • Status page hosted on GitHub Pages
  • Single-file configuration
  • No separate server needed

Pricing: Free and open source under MIT; it runs inside your own GitHub repository without a separate subscription.

Read more about UpptimeWebsite GitHub

Gatus

A developer-oriented health dashboard and status page that checks services over HTTP, ICMP, TCP and DNS and sends alerts to many chat and paging tools.

GitHub stars
12k
Last commit
2 days ago
Latest release
v5.37.0
Licence
Apache-2.0
Self-hosted
Yes
Hosted version
Available
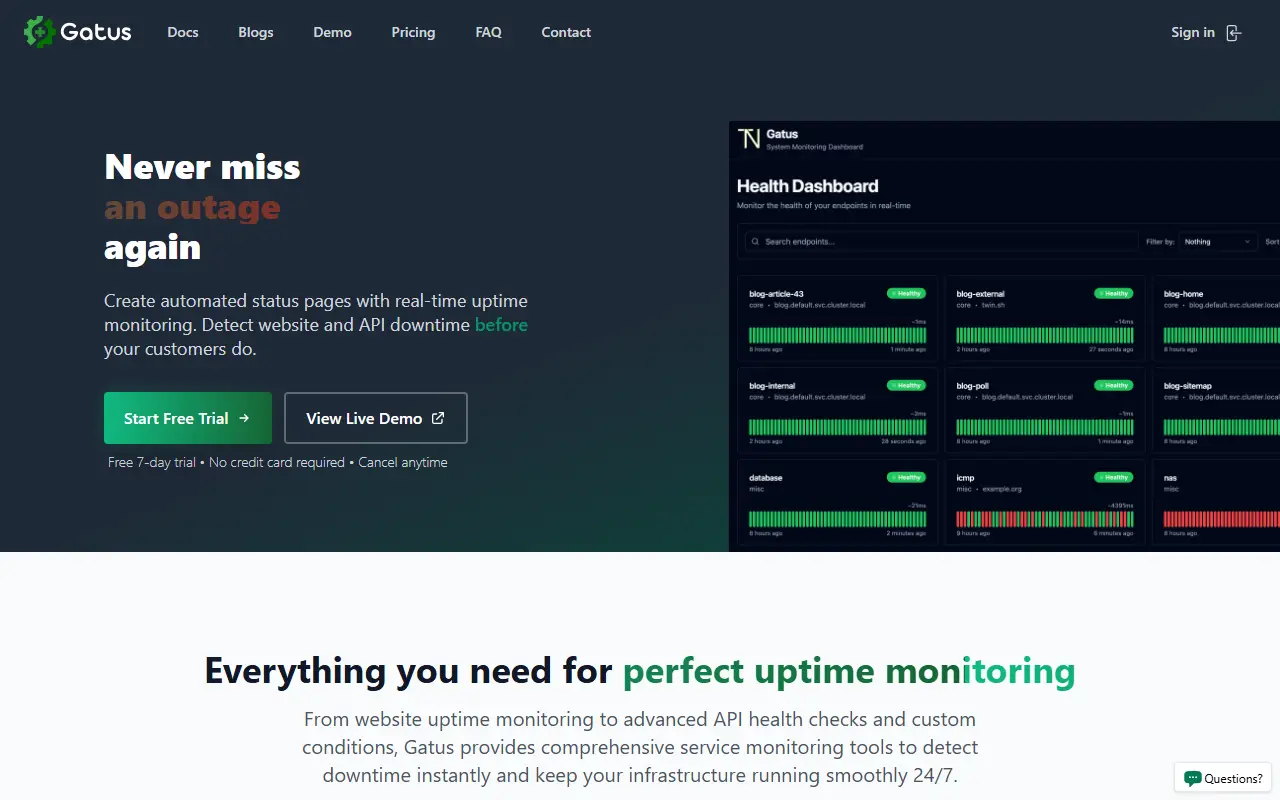
gatus.ioGatus homepage screenshot

Gatus is a developer-oriented health dashboard and status page for monitoring services. Each endpoint is checked using HTTP, ICMP, TCP or DNS queries, and the result is evaluated against a list of conditions covering values such as the status code, response time, certificate expiration and response body.

Checks can be paired with alerting through Slack, Microsoft Teams, PagerDuty, Discord, Twilio and many more providers, and the documentation lists dozens of alert integrations, from email and Matrix to Opsgenie and ntfy. Configuration is done in a file, with support for external endpoints, announcements, suites in alpha, storage options, tunneling and a web UI. Incident support is part of the pitch.

Gatus is written in Go and licensed under Apache-2.0, and it is easy to deploy with Docker or in Kubernetes. The author runs it in his own cluster to watch core applications. Anyone who prefers not to run it can use the managed offering at gatus.io.

Key features

  • HTTP, ICMP, TCP and DNS health checks
  • Conditions on status, latency and certificates
  • Alerts to Slack, Teams, PagerDuty and more
  • Public status page and dashboard
  • Simple file-based configuration
  • Docker and Kubernetes deployment

Pricing: Free and open source under Apache-2.0; a managed option is available at gatus.io.

Read more about GatusWebsite GitHub

Checkmate

Self-hosted monitoring tool that tracks server uptime, response times, incidents and hardware stats with real-time dashboards.

GitHub stars
11k
Last commit
yesterday
Latest release
v3.12.0
Licence
AGPL-3.0
Self-hosted
Yes
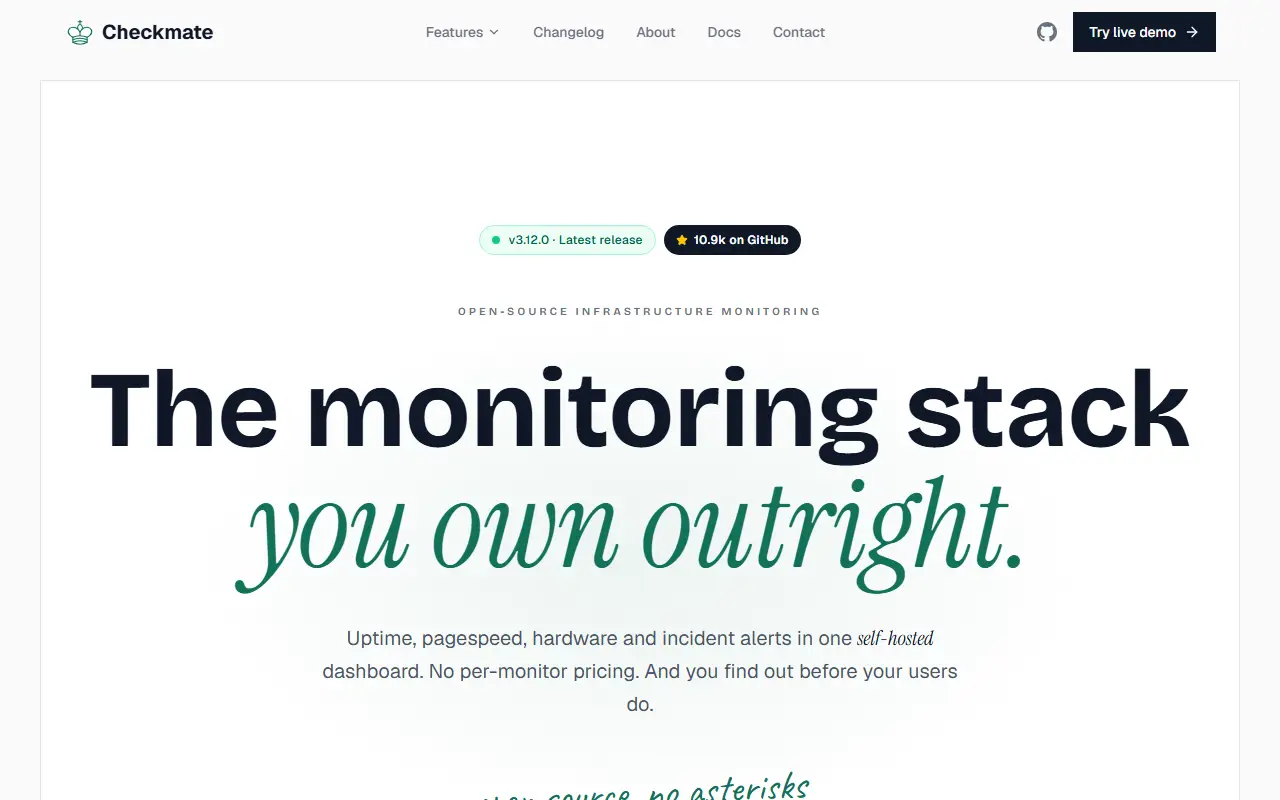
checkmate.soCheckmate homepage screenshot

Checkmate is an open-source, self-hosted monitoring application for uptime and infrastructure. It regularly checks whether a server or website is reachable and performing well, and it presents availability, downtime and response time in real-time visualizations with alerts and reports. The repository contains both the frontend and the backend.

An optional agent called Capture collects deeper server data, including CPU, RAM, disk and temperature readings, from remote machines. Capture is written in Go and runs on Linux, Windows, macOS, Raspberry Pi or any device that can run Go. Topics in the repository also mention incident handling and status pages, and the interface uses Material UI components.

Checkmate is written in TypeScript and licensed under AGPL-3.0, and the quickest installation route requires Docker and Git. The project offers a live demo, a user's guide, and translations of the README into many languages. It is positioned as a self-hosted option for teams that currently use hosted uptime services.

Key features

  • Website and server uptime checks
  • Response time tracking with dashboards
  • Incident tracking and alerts
  • Capture agent for CPU, RAM, disk and temperature
  • Docker-based installation
  • Demo instance and user guide

Pricing: Free and open source under the AGPL-3.0 license.

Nezha

A self-hosted, lightweight monitoring and operations tool for servers and websites, with alerts, scheduled tasks and a web terminal.

GitHub stars
10k
Last commit
yesterday
Latest release
v2.3.17
Licence
Apache-2.0
Self-hosted
Yes
nezhahq.github.ioNezha homepage screenshot

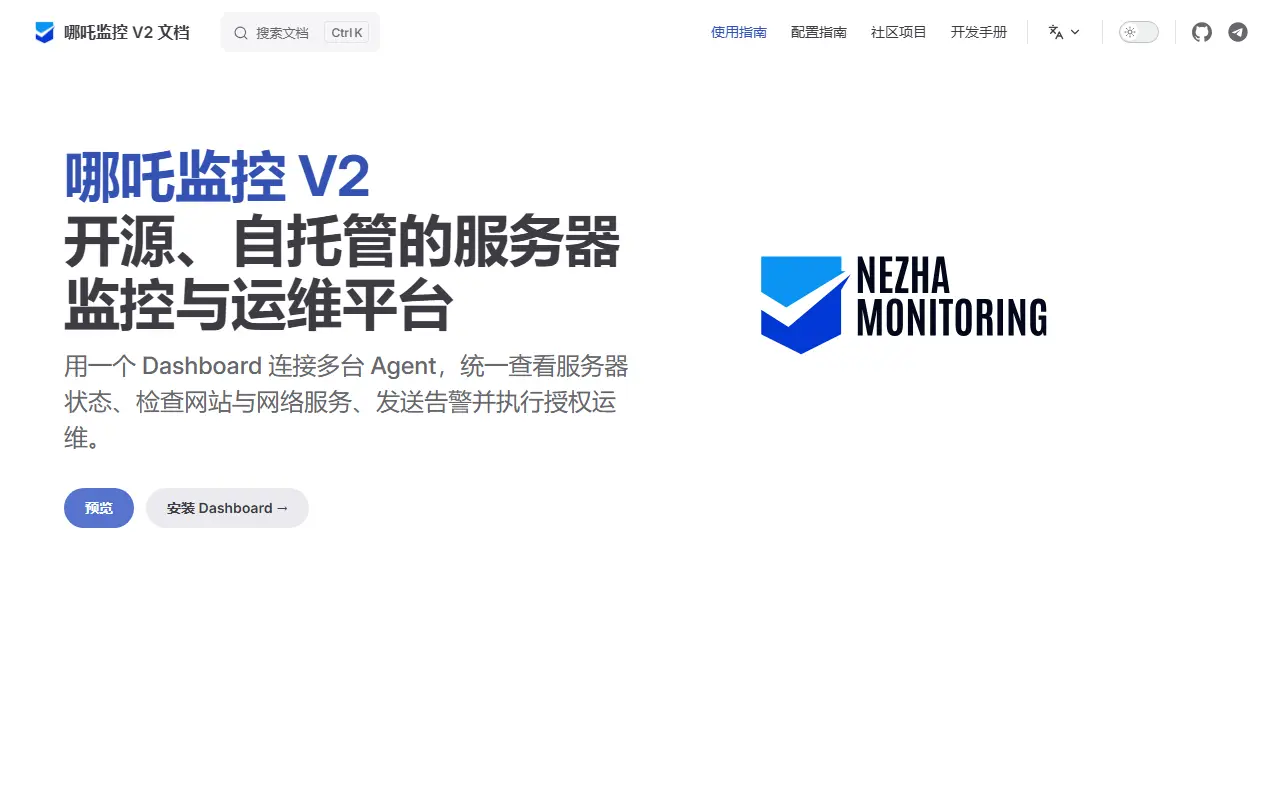
Nezha is a self-hostable monitoring and O&M tool for servers and websites, written in Go. It tracks system status for your machines and checks websites, including changes to or the expiry of SSL certificates, over HTTP, TCP and ping.

Beyond status checks, it can push alerts to notification channels, run scheduled tasks on monitored servers and open a web terminal to them. It has a user-facing dashboard and an admin backend, and the community offers alternative themes for the public front end. Documentation is available in English and Chinese, and translations are managed on Hosted Weblate.

Nezha is released under the Apache-2.0 licence and run on your own server. It is aimed at individuals, hobbyists and small teams that want a simple status page and light remote management of a handful of servers rather than a heavyweight observability stack.

Key features

  • Server status monitoring
  • HTTP, TCP and ping checks
  • SSL certificate expiry alerts
  • Push notifications for alerts
  • Scheduled tasks on servers
  • Web terminal access
  • Customizable front-end themes

Pricing: Free and open source under the Apache-2.0 licence.

Read more about NezhaWebsite GitHub

OpenStatus

An open-source status page and uptime monitoring platform where monitors and pages are declared as code in YAML or Terraform, available managed or self-hosted.

GitHub stars
9.2k
Last commit
today
Licence
AGPL-3.0
Self-hosted
Yes
Hosted version
Available
openstatus.devOpenStatus homepage screenshot

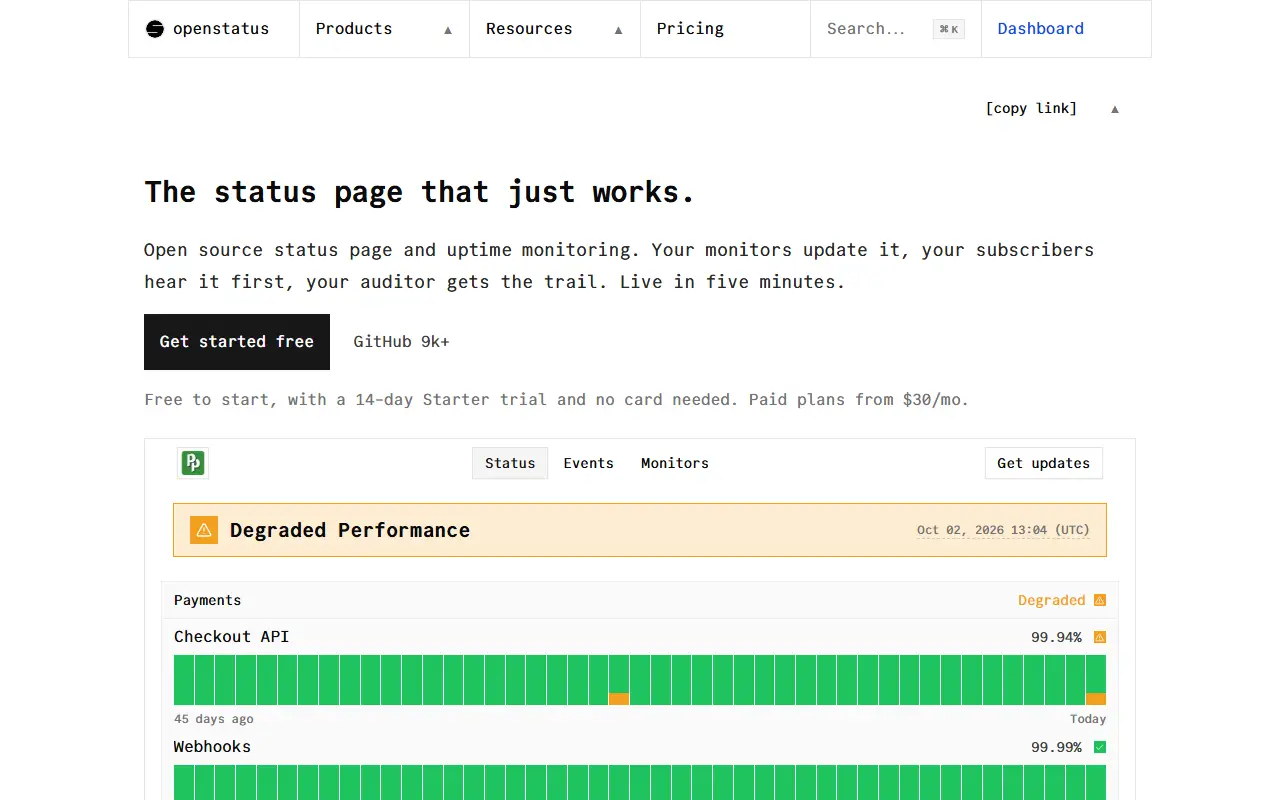
Openstatus is an uptime monitoring and status page platform, open source and built around infrastructure as code. Monitors, status pages and alert channels are written in YAML or Terraform and applied through the CLI or CI, and they can also be operated by AI assistants such as Claude, ChatGPT or Cursor through an MCP server.

The platform combines status pages and monitoring in one tool. Status pages can use custom domains and password protection, schedule maintenance windows, and notify subscribers by email, RSS or webhooks. Monitoring checks servers, websites and APIs from 28 regions across three cloud providers in parallel, with alerts through Slack, Discord, PagerDuty, email and more. Incident management lets teams open and manage incidents from the dashboard or Slack, with severity, a commander and a full timeline.

Openstatus is available as a managed service or can be self-hosted under the AGPL-3.0 licence, and private locations run in a very small Docker image. The README highlights flat pricing with unlimited members, with a JSON CLI, typed API and audit log for every change. It suits engineering teams that want monitoring configured in version control.

Key features

  • Monitors and status pages as code
  • YAML and Terraform configuration
  • Uptime checks from 28 global regions
  • Custom domains and maintenance windows
  • Incident management with timelines
  • MCP server and JSON CLI
  • Subscriber notifications by email and RSS

Pricing: Free Hobby plan with one monitor. Starter is $30, Pro $100 and Scale $500 per month, with 2 months free on annual billing and a 14-day Starter trial. Enterprise is custom.

Tianji

All-in-one monitoring hub combining website analytics, uptime checks, and server status in a single self-hostable app.

GitHub stars
3.1k
Last commit
3 days ago
Latest release
v1.33.7
Licence
Apache-2.0
Self-hosted
Yes
tianji.devTianji homepage screenshot

Tianji is an open-source project that combines website analytics, uptime monitoring, and server status reporting in one application. The authors built it because they were running separate tools for page views, network availability, and server health, and wanted a single place for all three. It is released under the Apache-2.0 license.

On the analytics side it covers page views and visits in the style of Google Analytics or Umami, the uptime monitor checks the availability and network quality of sites, and server status data is reported from your machines. The README also describes a telemetry use: developers of self-deployable applications can collect basic information about how others install their software.

Tianji is written in TypeScript and deployed with Docker, and its topics reference Umami and Uptime Kuma as comparable tools. It suits developers, indie hosts, and small teams who want to keep analytics and monitoring data under their own control instead of relying on separate hosted products.

Key features

  • Website analytics for page views and visits
  • Uptime monitoring for sites and services
  • Server status reporting
  • Telemetry collection for open-source apps
  • Docker-based deployment

Pricing: Self-hosting is free with unlimited users and storage. A paid cloud hosting option is listed as coming soon, with a waitlist and no price.

Read more about TianjiWebsite GitHub

CheckCle

CheckCle is a self-hosted monitoring platform for uptime checks, server metrics, SSL expiry, incidents, status pages and alerts.

GitHub stars
3.3k
Last commit
2 mo ago
Latest release
v1.6.0
Licence
MIT
Self-hosted
Yes

CheckCle is an open-source, self-hosted monitoring platform for systems, applications and infrastructure. It gives developers, sysadmins and DevOps teams real-time uptime monitoring, distributed regional checks, incident tracking and alerts in one place, and can be deployed anywhere with Docker.

Service monitoring covers HTTP, DNS, ping and TCP-based services such as FTP and SMTP, with response times and incident history for up, down, warning and paused states. It also monitors SSL certificates and domain expiry, and tracks CPU, RAM, disk and network on Linux servers and, in beta, Windows through a one-line agent script. Other features include scheduled maintenance, public status pages, reports, user management, themes and notifications through email, Telegram, Discord, Slack, Matrix and more.

CheckCle is written in Go and TypeScript, uses PocketBase, and is licensed under MIT. A live demo is linked from the README, and the interface is available in several languages. It suits small teams and homelabs looking for a self-hosted alternative to uptime and status page services.

Key features

  • HTTP, DNS, ping, and TCP monitoring
  • Distributed regional checks
  • SSL and domain expiry tracking
  • Server metrics via lightweight agent
  • Public status pages
  • Alerts to email, Telegram, Slack, and more

Pricing: Free and open source under the MIT licence.

Read more about CheckCleWebsite GitHub

ciao

ciao is a self-hosted HTTP monitoring tool that checks URLs on a cron schedule and sends email or webhook alerts when their status changes.

GitHub stars
2k
Last commit
2 mo ago
Latest release
1.10.1
Licence
MIT
Self-hosted
Yes
brotandgames.comciao homepage screenshot

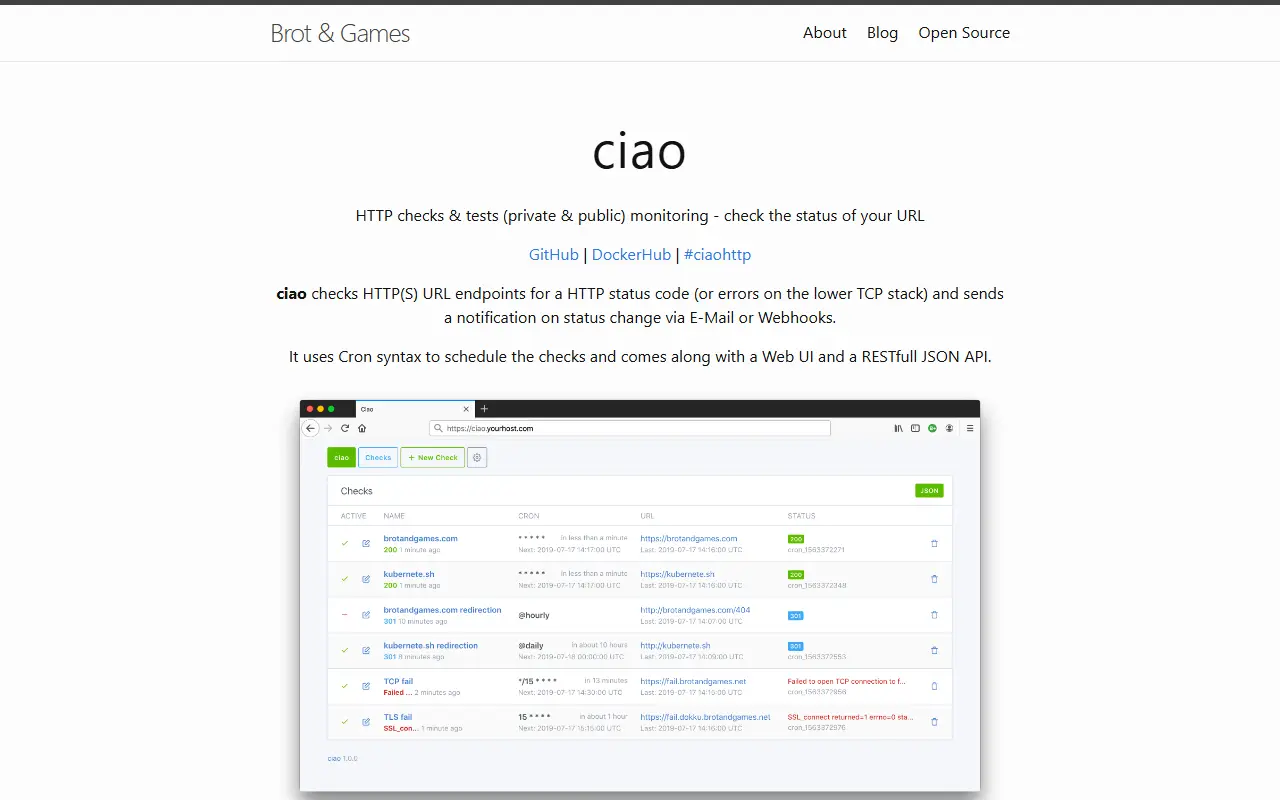
ciao, from Brot and Games, is a small web application that checks HTTP and HTTPS endpoints for a status code, or for lower-level TCP errors, and sends a notification when the status changes. It was built to be easy to install and maintain, with no external dependencies such as databases or caches, in both public and private environments.

Checks are scheduled with cron syntax, and the app comes with a web UI and a RESTful JSON API. It tracks status changes, checks TLS certificate expiry once a day and warns when a certificate has under 30 days left. Notifications can go out by email through providers such as Gmail or SendGrid, or by webhook to tools like Slack and Rocket.Chat, and an optional Prometheus metrics endpoint feeds dashboards in tools like Grafana.

Configuration is done through environment variables, and basic authentication can protect the app when combined with TLS. There are instructions for a Docker image, a Helm chart and a community Terraform provider. ciao is written in Ruby and licensed under MIT.

Key features

  • Scheduled HTTP and HTTPS checks via cron
  • Email and webhook notifications
  • TLS certificate expiry warnings
  • Web UI and RESTful JSON API
  • Prometheus metrics endpoint
  • Docker image and Helm chart

Pricing: Free and open source under the MIT license.

Read more about ciaoWebsite GitHub

Vigil

Self-hosted Rust status page that monitors servers and services and sends alerts through Slack, email, SMS and many other channels.

GitHub stars
1.9k
Last commit
5 mo ago
Latest release
v1.29.0
Licence
MPL-2.0
Self-hosted
Yes
crates.ioVigil homepage screenshot

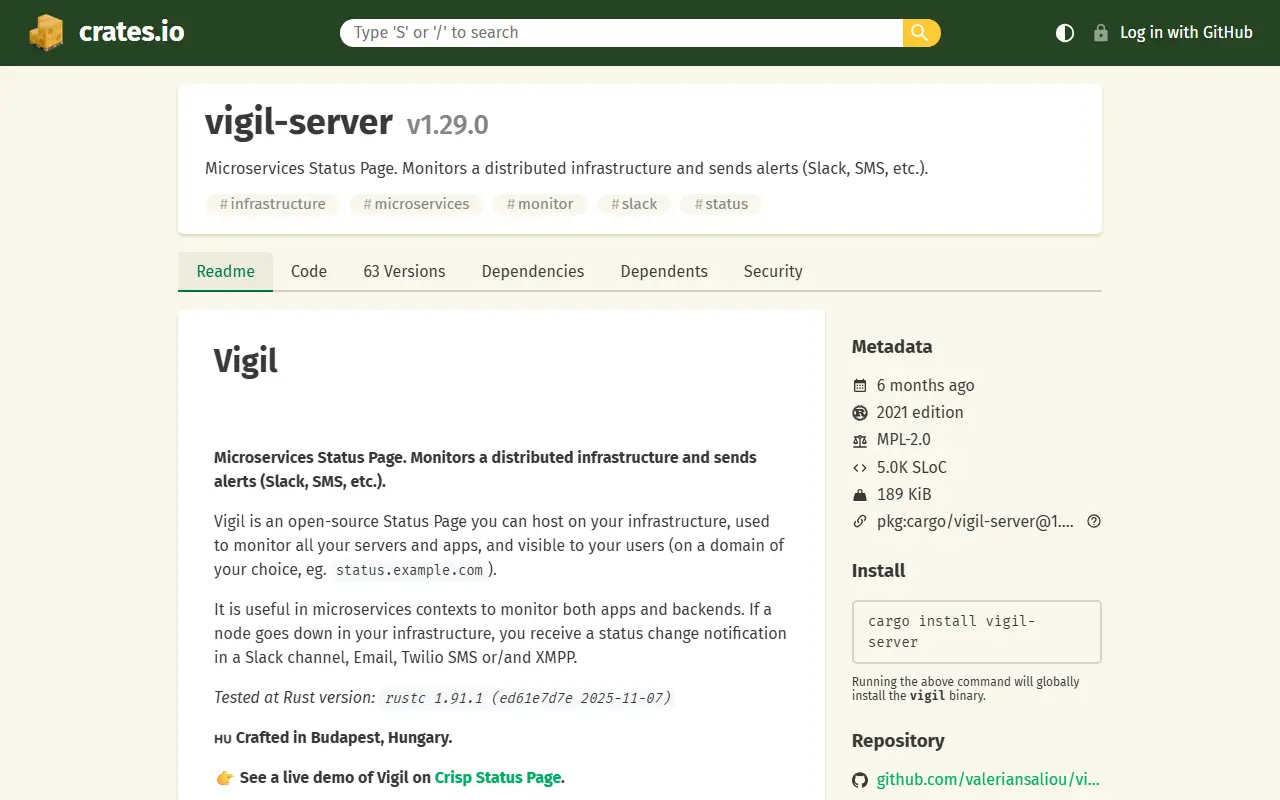
Vigil is an open-source status page and monitoring system you run on your own infrastructure. It watches your servers and apps, shows their health to users on a domain you choose, such as status.example.com, and notifies your team when a service goes down or recovers. It is particularly aimed at microservices setups where both backends and apps need monitoring.

Vigil can probe HTTP, TCP, SSH and ICMP targets for reachability, and applications can also report their own health through the Vigil Reporter library. Notification channels include email, Twilio SMS, Slack, Zulip, Telegram, Pushover, Gotify, XMPP, Matrix, Cisco Webex and generic webhooks. The generated status page can also carry announcements, for example to warn users about planned maintenance.

The software is written in Rust, licensed under MPL-2.0, and published as a crate on crates.io. Because you host it yourself, you control where checks run and how the public page looks, and you can place it on a separate domain from your main product. The README links a live demo on a public status page.

Key features

  • Automatic probing of HTTP, TCP, SSH and ICMP targets
  • Application health reporting through a reporter library
  • Public status page on your own domain
  • Alerts via Slack, email, SMS and webhooks
  • Announcements for planned maintenance
  • Support for Matrix, Telegram, Zulip and XMPP

Pricing: Free and open source under MPL-2.0.

Read more about VigilWebsite GitHub

3 more UptimeRobot alternatives

UptimeRobot alternatives: questions

What is the best open-source alternative to UptimeRobot?
Uptime Kuma is the top-ranked open-source alternative to UptimeRobot on Enlisted: A self-hosted monitoring tool that checks websites, ports, DNS and containers, sends alerts through many notification services and publishes status pages. Other strong options are Upptime, Gatus, Checkmate and Nezha.
Are these UptimeRobot alternatives free?
All 13 are open source, so the code is free to use under its licence, and all of them can be self-hosted on your own server or computer. 2 also offer a paid or managed cloud version if you'd rather not host it yourself.
How is this list of UptimeRobot alternatives ranked?
By a score built from GitHub stars, star growth over the last 30 days and how recently the code changed. 7 of these projects shipped code in the last 30 days. Data is refreshed daily, and nobody can pay to move up.

People also look for alternatives to…

View all