#1
k6 is an open-source load testing tool where tests are written as JavaScript code and run on a fast Go engine.
- GitHub stars
- 32k
- Last commit
- yesterday
- Latest release
- v2.3.0
- Licence
- AGPL-3.0
- Hosted version
- Available
grafana.com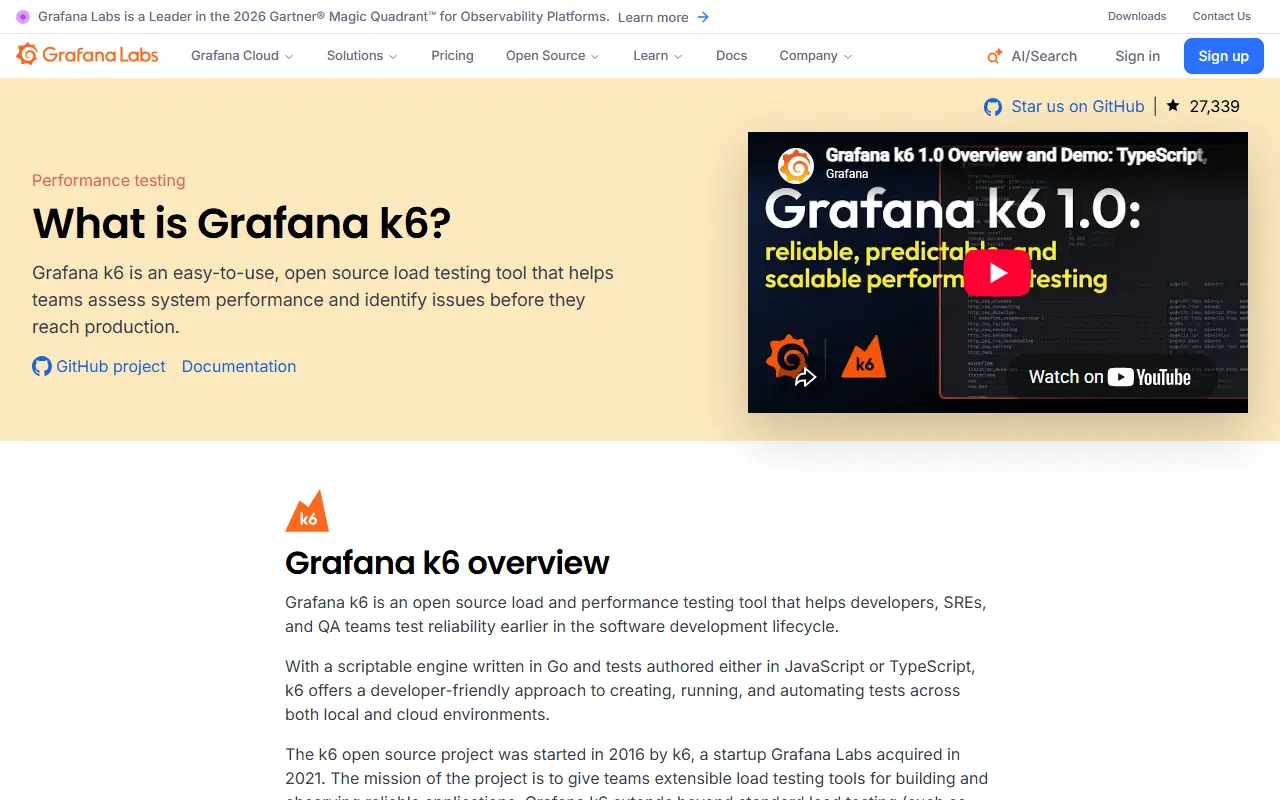
k6 is a load-testing tool for developers and testers, described as unit testing for performance. Test scripts are written in JavaScript and executed by an embedded engine written in Go, combining scripting familiarity with efficient load generation. It is maintained under the Grafana organization and released under the AGPL-3.0 license.
Because tests are code, scripts can be modularized, version controlled and run from the command line, in CI or across a Kubernetes cluster. k6 supports HTTP, WebSockets, gRPC and browser protocols, and an extension ecosystem adds more. Results can be summarized or exported as granular metrics to the service of your choice, and the tool integrates natively with Grafana Cloud for test execution and analysis. For people who prefer not to write code, k6 Studio is a desktop app that generates scripts.
Key features
- Load tests written as JavaScript code
- Go engine for efficient traffic generation
- HTTP, WebSocket, gRPC and browser protocols
- Extension ecosystem for added capabilities
- Flexible metrics export to other services
- k6 Studio desktop app for no-code scripts
Pricing: The Grafana Cloud page, which covers k6 performance tests, lists a free plan, Pro from $19 per month plus usage, and Enterprise starting at a $25,000 per year spend commit.
#2
An open-source AIOps and alert management platform that gathers alerts from many monitoring tools into one place, with deduplication, correlation, enrichment and workflows.
- GitHub stars
- 13k
- Last commit
- 3 days ago
- Latest release
- v0.55.0
- Self-hosted
- Yes
keephq.dev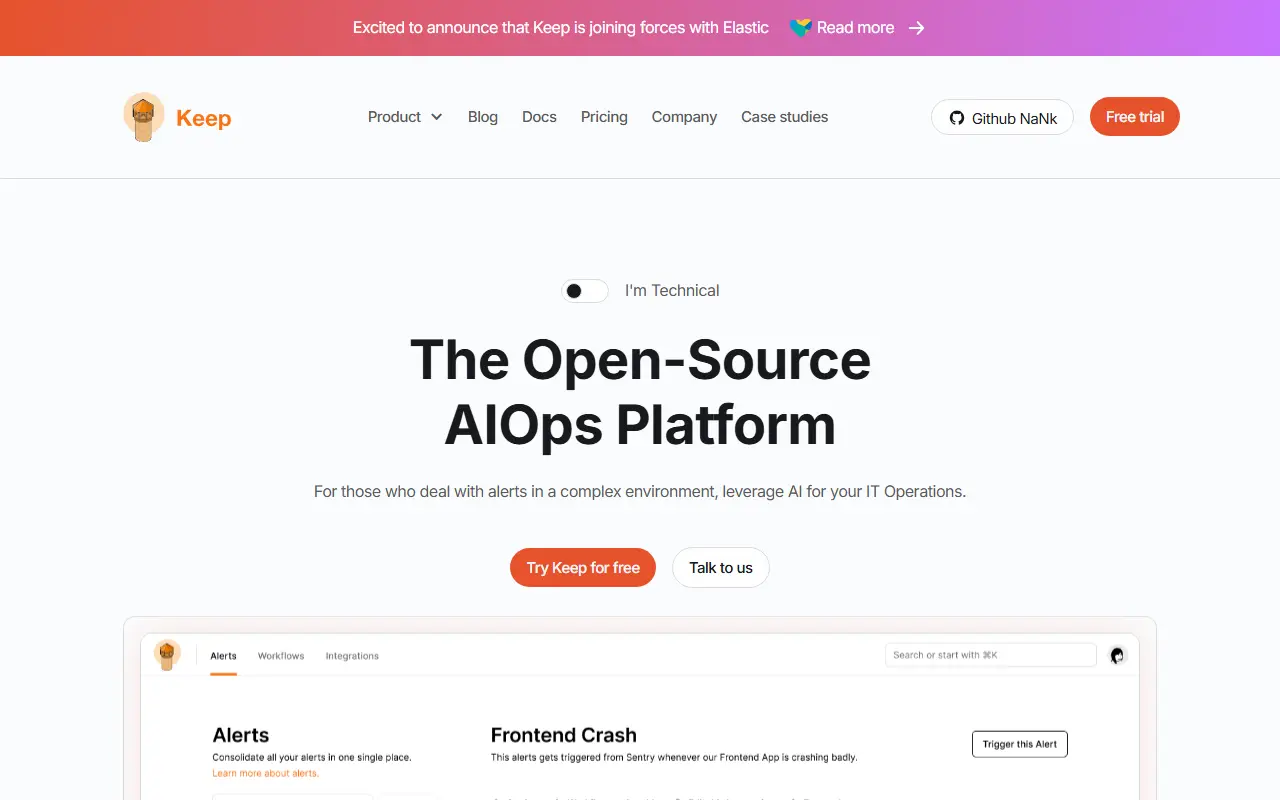
Keep is an open-source platform for managing alerts and incidents. Teams that run several monitoring tools can bring their alerts into a single view, which saves them from jumping between dashboards, and then clean up the noise through deduplication, filtering, correlation and enrichment.
The platform connects to a long list of monitoring and observability products, and its integrations work in both directions so that data can be synced back to those tools. Workflows act like GitHub Actions for monitoring, letting you automate responses to alerts. AI features can correlate alerts and summarize incidents, using backends such as Anthropic, OpenAI, DeepSeek, Gemini, Grok or local models served by Ollama and LlamaCPP.
Keep is written in Python and the repository lists its license as Other. It positions itself as a customizable alternative to hand-built alert pipelines, with dashboards, documentation, a hosted demo and a request process for new providers. It suits SRE and DevOps teams dealing with alert fatigue across tools.
Key features
- Single view for alerts and incidents
- Alert deduplication, filtering and correlation
- Alert enrichment from external sources
- Bi-directional integrations with monitoring tools
- Workflow automation for alert handling
- AI-assisted correlation and incident summaries
- Choice of cloud or local AI backends
Pricing: Free Startup plan for personal projects. Growth starts at $199 per month; Enterprise + AI is custom. Self-hosting is available and a free trial is offered.
#3
An open-source platform that combines uptime monitoring, status pages, on-call, incident management, logs, traces, metrics and error tracking in one self-hostable app.
- GitHub stars
- 7.8k
- Last commit
- today
- Latest release
- 14.0.108
- Self-hosted
- Yes
- Hosted version
- Available
oneuptime.com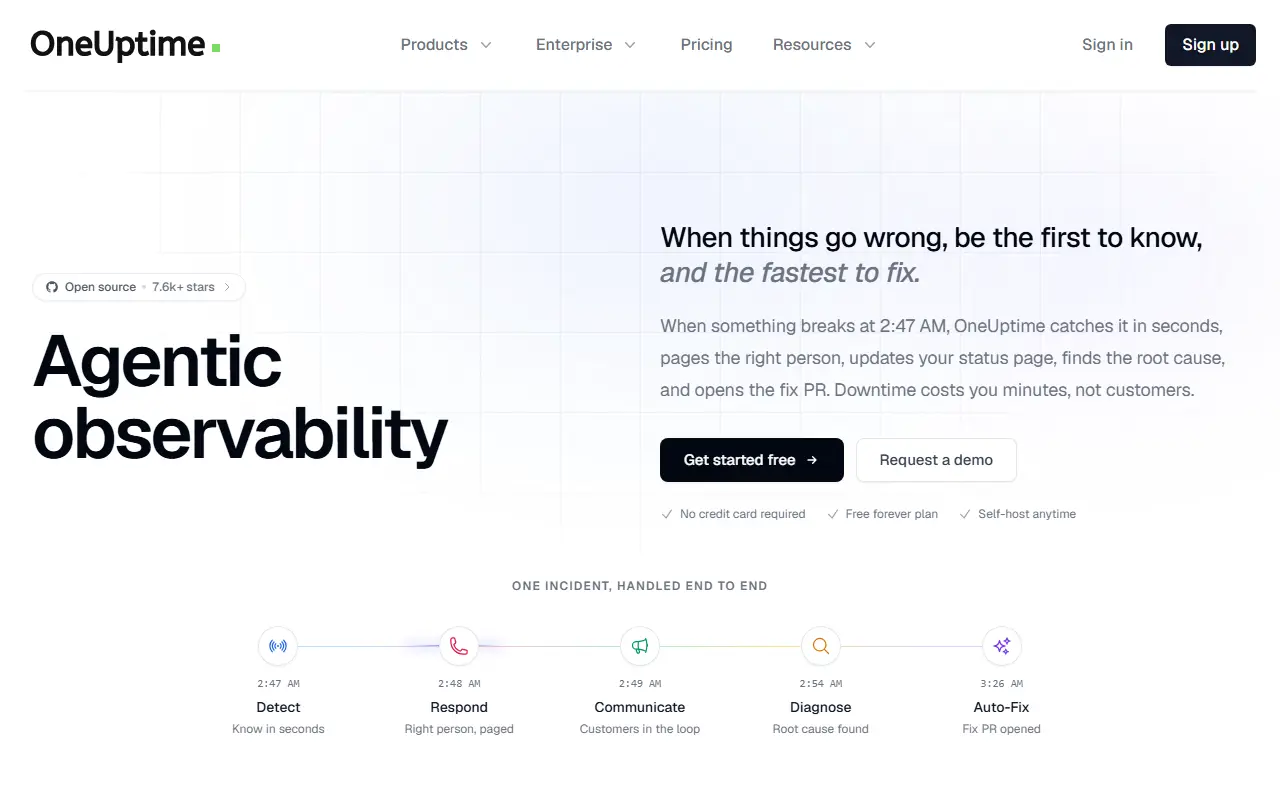
OneUptime is an open-source monitoring and observability platform that aims to replace a shelf of separate SaaS tools. It covers uptime monitoring, status pages, on-call and alerting, incident management, logs, traces, metrics, APM and error tracking in one application, and adds AI-assisted features such as helping find the root cause and proposing a fix.
Its README maps each module to the tools it can replace: Pingdom and UptimeRobot for uptime checks across websites, APIs, ports, SSL and DNS, StatusPage.io for branded public and private status pages, PagerDuty and Opsgenie for schedules, escalation policies and SMS, call, push or Slack alerts, Incident.io for declaring and triaging incidents with post-mortems, Datadog and New Relic for traces and dashboards, Loggly for logs, and Sentry for exceptions.
The Community Edition is open source under Apache 2.0 and free to self-host, and OneUptime Cloud offers a free-forever plan with no credit card. It is written in TypeScript. It suits small and mid-sized engineering teams that want one platform for reliability work rather than integrating many vendors.
Key features
- Uptime monitoring for sites, APIs and ports
- Branded public and private status pages
- On-call schedules and escalation policies
- Incident management with post-mortems
- Logs, traces, metrics and APM
- Error tracking with stack traces
Pricing: Free plan with one status page. Growth is $22 and Scale $99 per month with 14-day trials; Enterprise is custom. Monitors, SMS, telemetry and AI use are billed on top.
#4
The Prometheus component that receives alerts from clients, then deduplicates, groups, silences and routes them to receivers such as email, PagerDuty and Opsgenie.
- GitHub stars
- 8.7k
- Last commit
- today
- Latest release
- v0.35.0
- Licence
- Apache-2.0
- Self-hosted
- Yes
prometheus.io
Alertmanager is the part of the Prometheus ecosystem that processes alerts sent by client applications, most often the Prometheus server. Instead of notifying people for every raw alert, it deduplicates and groups them, and routes them to the right receiver integrations.
Receivers include email, PagerDuty and Opsgenie, and the webhook receiver allows many other mechanisms. It also takes care of silencing alerts for a period and inhibition, where one alert suppresses others that it makes redundant. Routing is configured in YAML with a tree of routes starting from a root route that must have a receiver, plus global settings such as the SMTP host for mail notifications.
Alertmanager is written in Go and licensed under Apache-2.0. You can install it from precompiled binaries on prometheus.io, run the Docker image from Quay.io or Docker Hub, or build it from source with Go and Node.js, and the web interface is served on port 9093 by default. It suits any team that runs Prometheus and needs structured on-call notifications.
Key features
- Alert deduplication and grouping
- Routing tree to receivers
- Email, PagerDuty and Opsgenie integrations
- Webhook receiver for custom targets
- Silences for muting alerts
- Inhibition rules to suppress duplicates
- Docker images and binaries
Pricing: Free and open source under the Apache-2.0 licence.
#5
Official Dockerfiles for Zabbix, the open-source enterprise monitoring platform, for running its server, web interface, and agents in containers.
- GitHub stars
- 2.9k
- Last commit
- today
- Latest release
- 8.0.0
- Licence
- AGPL-3.0
- Self-hosted
- Yes
zabbix.com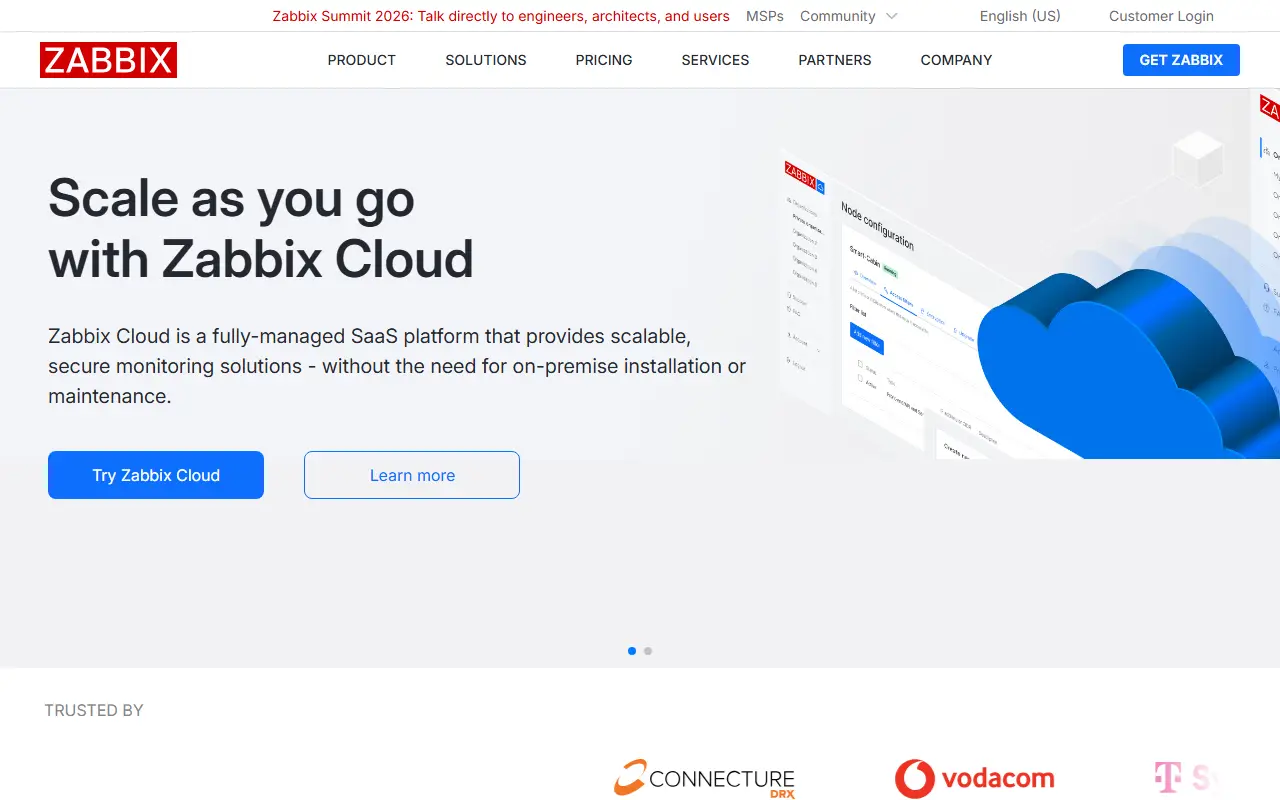
This repository holds the official Dockerfiles for Zabbix, an enterprise-class open-source distributed monitoring solution. Zabbix tracks many parameters of a network as well as the health and integrity of servers, and the Dockerfiles are used for automated builds published to the public Docker Hub registry. The repository is licensed under AGPL-3.0.
Zabbix itself offers flexible notifications, such as email alerts for nearly any event, along with reporting and data visualization based on stored data, which makes it useful for capacity planning. The images are provided on several base operating systems, including Alpine, CentOS, Oracle Linux, and Ubuntu, and the README includes usage instructions for running the components with Docker.
The project is aimed at system administrators and DevOps teams who want to deploy Zabbix in containers instead of installing packages by hand, whether for a lab or a production monitoring stack. The Zabbix website and Docker Hub organization provide the downloads and further documentation.
Key features
- Official Zabbix Dockerfiles
- Images for Alpine, CentOS, Oracle Linux, and Ubuntu
- Published to Docker Hub
- Server, web, and agent components in containers
- Email alerting and reporting from Zabbix
- Capacity planning data visualization
Pricing: Zabbix software has no license fee. Paid support subscriptions start at $325 per month for Silver and from $825 for Gold, billed annually; Platinum, Enterprise and Global are quoted.
#6
Host, service and network monitoring program written in C, with a plugin interface and an optional web interface.
- GitHub stars
- 2.1k
- Last commit
- 17 days ago
- Latest release
- nagios-4.5.14
- Licence
- GPL-2.0
Nagios Core is a monitoring program for hosts, services and networks, written in C and released under the GNU General Public License, version 2. Included CGI programs provide a web interface for current status, history and logs if you want one.
It checks network services such as SMTP, POP3, HTTP and PING, and host resources such as processor load and disk usage. Checks beyond the built-in ones come through a plugin interface for user-developed monitoring methods. You can define a hierarchy of parent hosts so that a host that is down can be told apart from one that is unreachable, and notifications go out when problems occur and when they are resolved. Documentation, downloads and quickstart installation guides are linked from the README.
Key features
- Monitors network services such as SMTP, POP3, HTTP and PING
- Monitors host resources like processor load and disk usage
- Plugin interface for custom service checks
- Parent host hierarchy distinguishes down from unreachable hosts
- Notifications on problems and recoveries
- Event handlers for proactive problem resolution
- Optional web interface for status and history

Icinga 2 is a scalable monitoring server that checks availability of network resources, sends outage notifications, and records performance data.
- GitHub stars
- 2.2k
- Last commit
- today
- Latest release
- v2.16.6
- Licence
- GPL-3.0
- Self-hosted
- Yes
icinga.com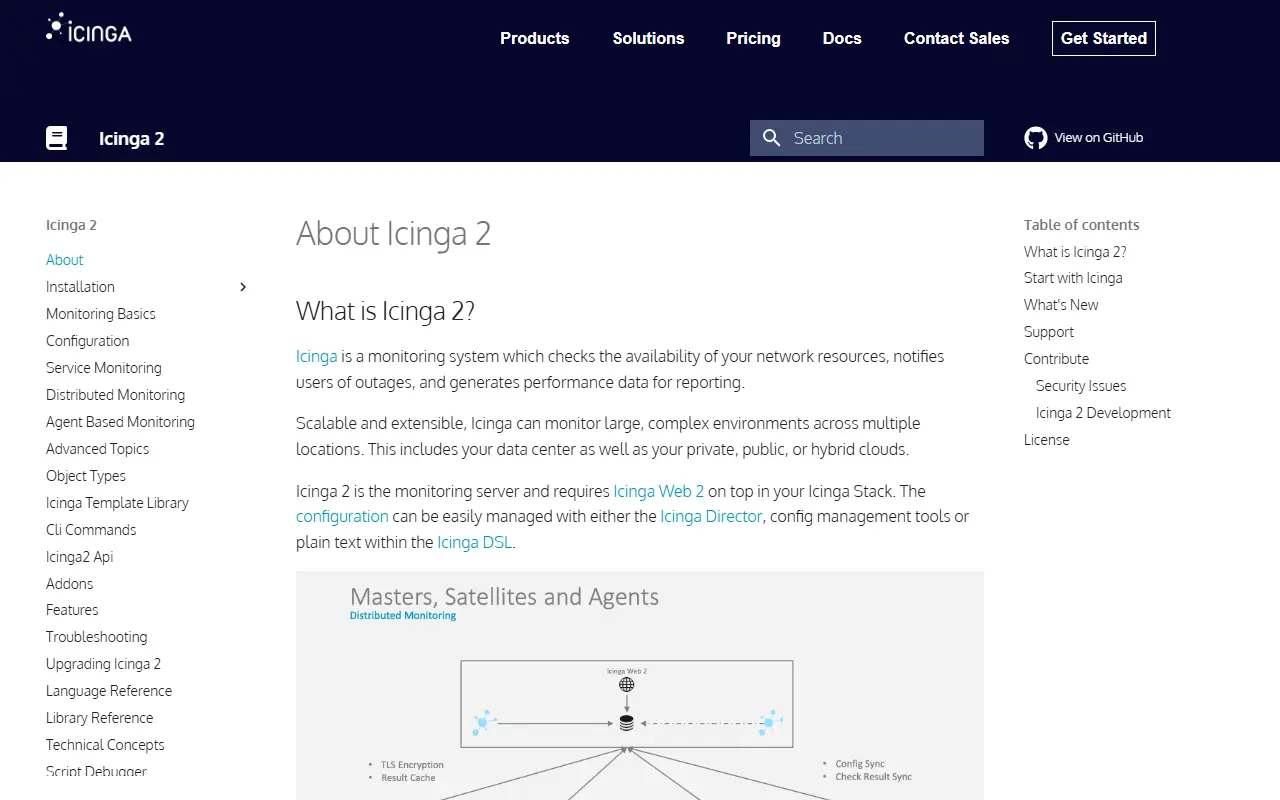
Icinga 2 is the core of the Icinga monitoring platform. It checks the availability of network resources, notifies users of outages, and generates performance data for reporting. It is built to scale and can monitor large, complex environments spanning multiple locations. The code is written in C++ and released under the GPL-3.0 license as stated in the input.
Configuration can be managed with the Icinga Director, with configuration management tools, or as plain text in the Icinga DSL, a powerful configuration language. The server offers a REST API, TLS-secured distributed monitoring with clustering, and integrations with metrics and logging backends such as Elastic, Graylog, InfluxDB, Graphite, and OpenTSDB. Icinga Web 2 is required on top for the web interface.
The README links to installation, monitoring basics, configuration, and distributed monitoring documentation. Icinga suits system administrators and operations teams who need a mature, configurable monitoring system for servers, networks, and services, especially those that want infrastructure-as-code style configuration.
Key features
- Availability checks for network resources
- Outage notifications
- Performance data generation
- Distributed monitoring with clustering
- REST API and configuration DSL
- Integrations with InfluxDB, Graphite, and Elastic
Pricing: The core is free and open source. Optional subscriptions are €5,000 per year for enterprise Linux packages, €2,000 for enterprise modules and from €15,000 for support, with a 60-day trial on the repository subscription.
#8
Sensu Go is an observability pipeline that consolidates monitoring tools and automates diagnosis and self-healing from bare metal to Kubernetes.
- GitHub stars
- 1.1k
- Last commit
- 7 days ago
- Latest release
- v6.15.0
- Licence
- MIT
sensu.io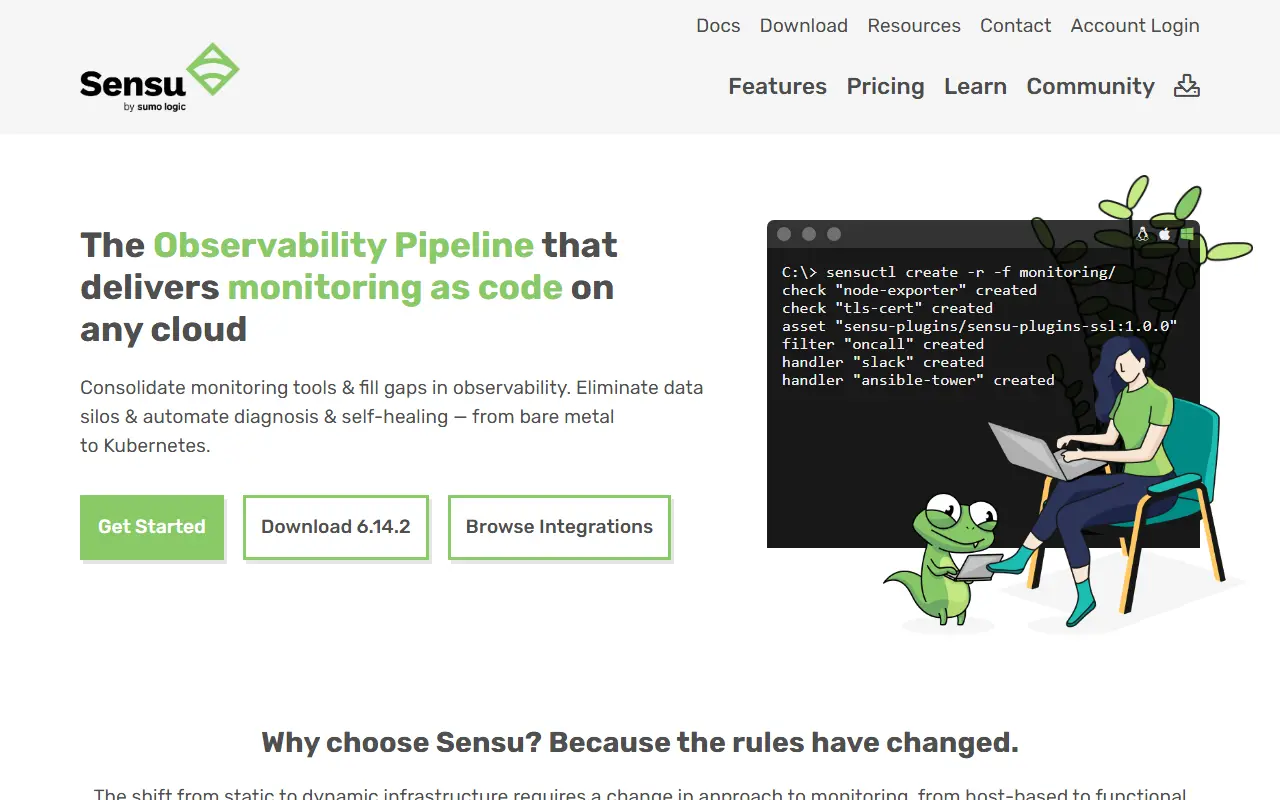
Sensu Go is an observability pipeline that delivers monitoring as code on any cloud. It consolidates monitoring tools and fills gaps in observability, eliminating data silos and automating diagnosis and self-healing from bare metal to Kubernetes.
The shift from static to dynamic infrastructure requires a change in approach to monitoring, from host-based to functional role-based. Connectivity moves from remote polling to publish-subscribe, and the control plane moves from point-and-click interfaces to infrastructure as code workflows and self-service developer APIs.
Key features
- Fills gaps in observability between metrics, logging, and tracing
- Consolidates existing monitoring tools including Nagios, StatsD, Telegraf, Prometheus, and more
- Codifies monitoring workflows into declarative configuration files that can be shared, treated as code, edited, reviewed, and versioned
- Automates registration and de-registration of servers, containers, services, apps, functions, and connected devices

Oncall by LinkedIn is a free, BSD-licensed, self-hosted calendar tool for scheduling and managing on-call shifts, designed to feed dynamic ownership data to paging systems.
- GitHub stars
- 1.3k
- Last commit
- 1 yr ago
- Latest release
- v2.1.7
- Licence
- BSD-2-Clause
- Self-hosted
- Yes
oncall.tools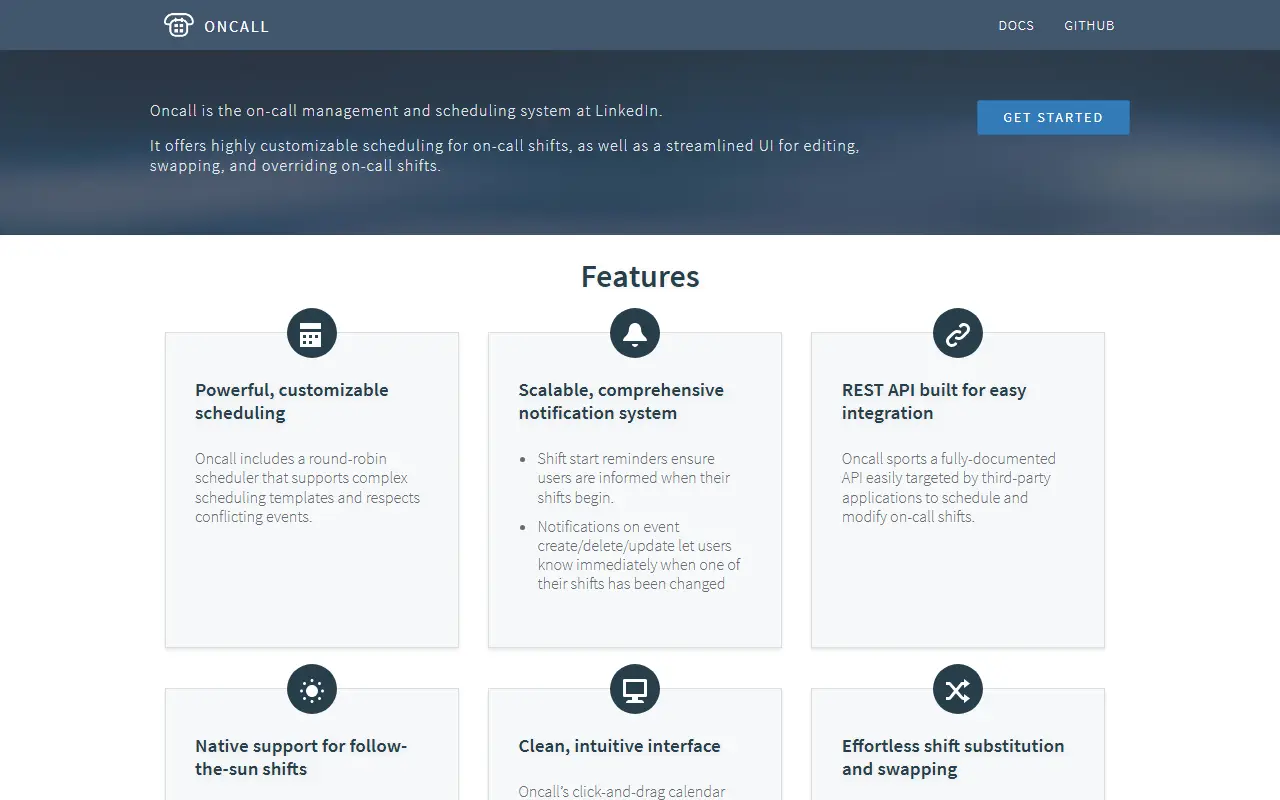
Oncall is a calendar application built by LinkedIn specifically for scheduling and managing on-call rotations. It is aimed at operations and engineering teams who need to track who is responsible for responding to incidents at any given time, and it is designed to act as a source of dynamic ownership information for paging systems such as Iris.
As a calendar-focused tool, its core job is representing on-call schedules in a way that other systems can query programmatically, rather than functioning as a full incident-management platform on its own. It integrates into a broader on-call and alerting workflow where a paging tool consults Oncall's schedule data to determine who to notify.
Oncall is written in Python and requires a MySQL database, with setup instructions covering local development, Docker Compose deployment, and configuration through a YAML file; dummy data can be imported for testing. It is released under the BSD-2-Clause license, and the README notes some current limitations, including no built-in test-running mechanism documented and a need to rebuild to apply code changes in some setups.
Key features
- On-call shift scheduling calendar
- Dynamic ownership data for paging systems
- MySQL-backed schedule storage
- Docker Compose deployment option
- Configurable via YAML
Pricing: Free and open source under the BSD-2-Clause license.
Commercial Rootly alternatives
Hosted, closed-source products that compete with Rootly.
Rootly alternatives: questions
- What is the best open-source alternative to Rootly?
- k6 is the top-ranked open-source alternative to Rootly on Enlisted: k6 is an open-source load testing tool where tests are written as JavaScript code and run on a fast Go engine. Other strong options are Keep, OneUptime, Alertmanager and Zabbix.
- What are the best commercial alternatives to Rootly?
- FireHydrant, incident.io, PagerDuty, xMatters and BigPanda are among the hosted, closed-source alternatives to Rootly listed on Enlisted, which lists 12 in total. Compare their pricing and features on each tool page.
- Are these Rootly alternatives free?
- All 9 are open source, so the code is free to use under its licence, and all of them can be self-hosted on your own server or computer. 2 also offer a paid or managed cloud version if you'd rather not host it yourself.
- How is this list of Rootly alternatives ranked?
- By a score built from GitHub stars, star growth over the last 30 days and how recently the code changed. 8 of these projects shipped code in the last 30 days. Data is refreshed daily, and nobody can pay to move up.
 TrackMedia
 TrackRev