 TrackMedia
 TrackRev
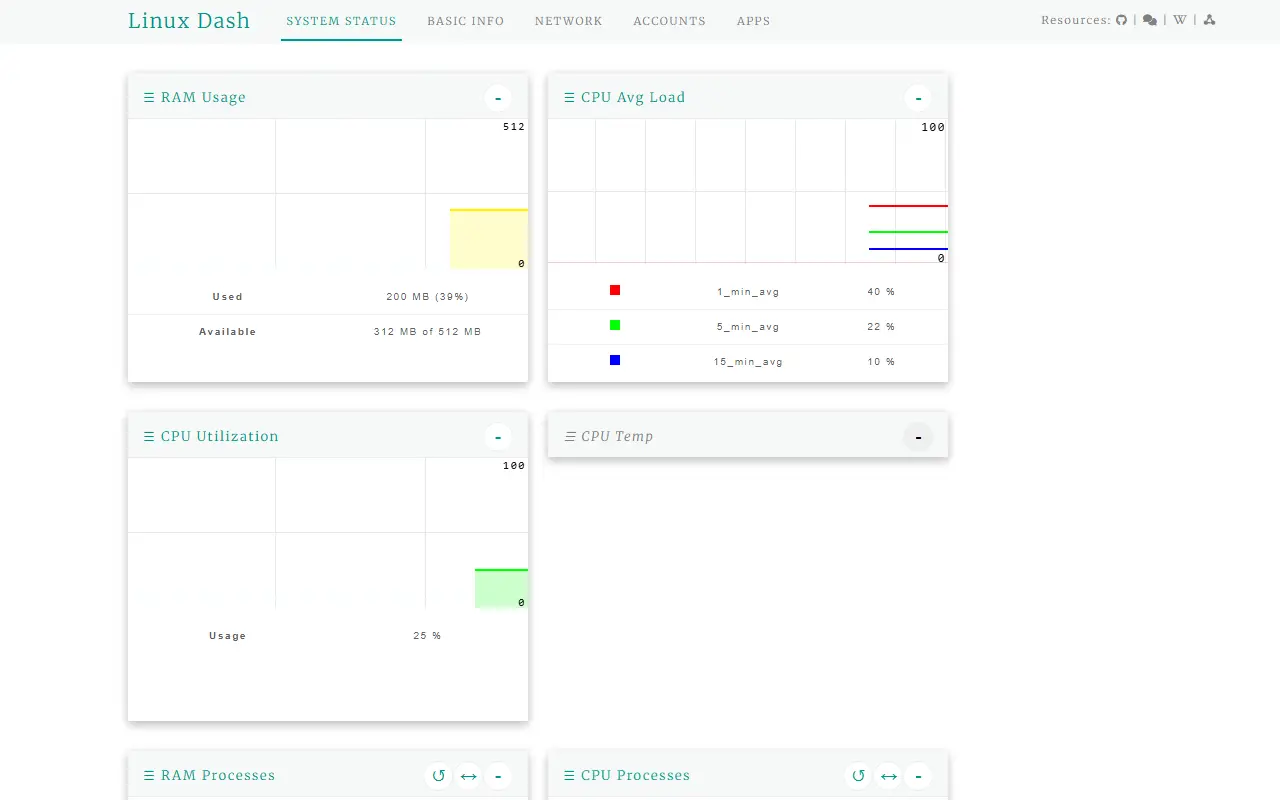
About Linux Dash
Linux Dash is a web dashboard for Linux systems, described as simple and low-overhead. It has sections for system status, basic info, network, accounts and apps. The project says it takes under 400KB on disk once the git folder is removed, and it is currently at version 2.0.
Installation means cloning the repository or downloading the zip, then starting one of the bundled servers. Node.js is the recommended choice, with Go, Python and PHP versions also included. The Node.js server listens on port 80 by default and every network interface, both of which can be changed with environment variables or flags.
The PHP version needs the exec, shell_exec and escapeshellarg functions enabled and a web server such as Apache or nginx pointed at the app directory. The project warns that it has no security or authentication features of its own, so installations should be protected separately.
Key features
- Small footprint under 400KB
- Choice of Node.js, Go, Python or PHP back end
- Drop-in installation from a clone or zip
- Low-overhead web dashboard for Linux
- Node.js server starts on port 80 by default
- PHP version needs shell functions enabled
Good fit for
- Checking a Linux server's status in a browser
- Lightweight monitoring on small machines
Linux Dash: questions and answers
- What is Linux Dash used for?
- Linux Dash is a low-overhead web dashboard for monitoring Linux servers, with back ends in Node.js, Go, Python or PHP. It is a good fit for checking a Linux server's status in a browser and lightweight monitoring on small machines.
- Is Linux Dash open source?
- Yes. Linux Dash is open source under the MIT licence. Its source code is on GitHub at tariqbuilds/linux-dash and is written mainly in JavaScript.
- Is Linux Dash free?
- Yes. Linux Dash is open source, so the software itself is free to use.
- Can I self-host Linux Dash?
- Yes. Linux Dash can be self-hosted on your own server or infrastructure.
- What are some alternatives to Linux Dash?
- Similar open-source tools in the Monitoring & Observability category include Komari, dashdot and MangoHud. SaaS products in the same category include AppSignal, Scout Monitoring and PHP Profiler (by Tideways).
- Is Linux Dash actively maintained?
- The most recent commit to Linux Dash was on 16 April 2024, and the latest release is 2.0, published on 14 May 2017. The project has 11k stars on GitHub.
Open-source alternatives to Linux Dash
See all
Komari
Monitoring & Observability
A simple server monitor tool.
MITvs Site24x7★ 7k
dashdot
Monitoring & Observability
A simple, modern server dashboard, primarily used by smaller private servers
MIT★ 3.8kMangoHud
Monitoring & Observability
A Vulkan and OpenGL overlay for monitoring FPS, temperatures, CPU/GPU load and more.
MIT★ 9.2k
Cachet
Monitoring & Observability
From startups to Fortune 500 companies, organizations worldwide trust Cachet to streamline
OSSvs Instatus★ 15k
Kener
Monitoring & Observability
Stunning status pages, batteries included!
MITvs Atlassian Statuspage★ 5.2k
Monitoror
Monitoring & Observability
Unified monitoring wallboard — Light, ergonomic and reliable monitoring for anything.
MIT★ 4.4k
SaaS alternatives to Linux Dash
See all
AppSignal
Monitoring & Observability
Application monitoring for Ruby, Elixir, Node.js and Python with errors and metrics
SaaS
Scout Monitoring
Monitoring & Observability
Application monitoring for errors, logs and traces in Ruby, Python, Node.js, PHP and Elixir apps
SaaS
PHP Profiler (by Tideways)
Monitoring & Observability
Shows where PHP performance breaks down in production in real time
SaaS
Amazon CloudWatch
Monitoring & Observability
AWS service for metrics, logs, alarms and dashboards
SaaS
AppDynamics
Monitoring & Observability
Cisco application performance monitoring that maps technical metrics to business impact
SaaS
Atlassian Statuspage
Monitoring & Observability
Hosted status page and incident communication tool from Atlassian
SaaS