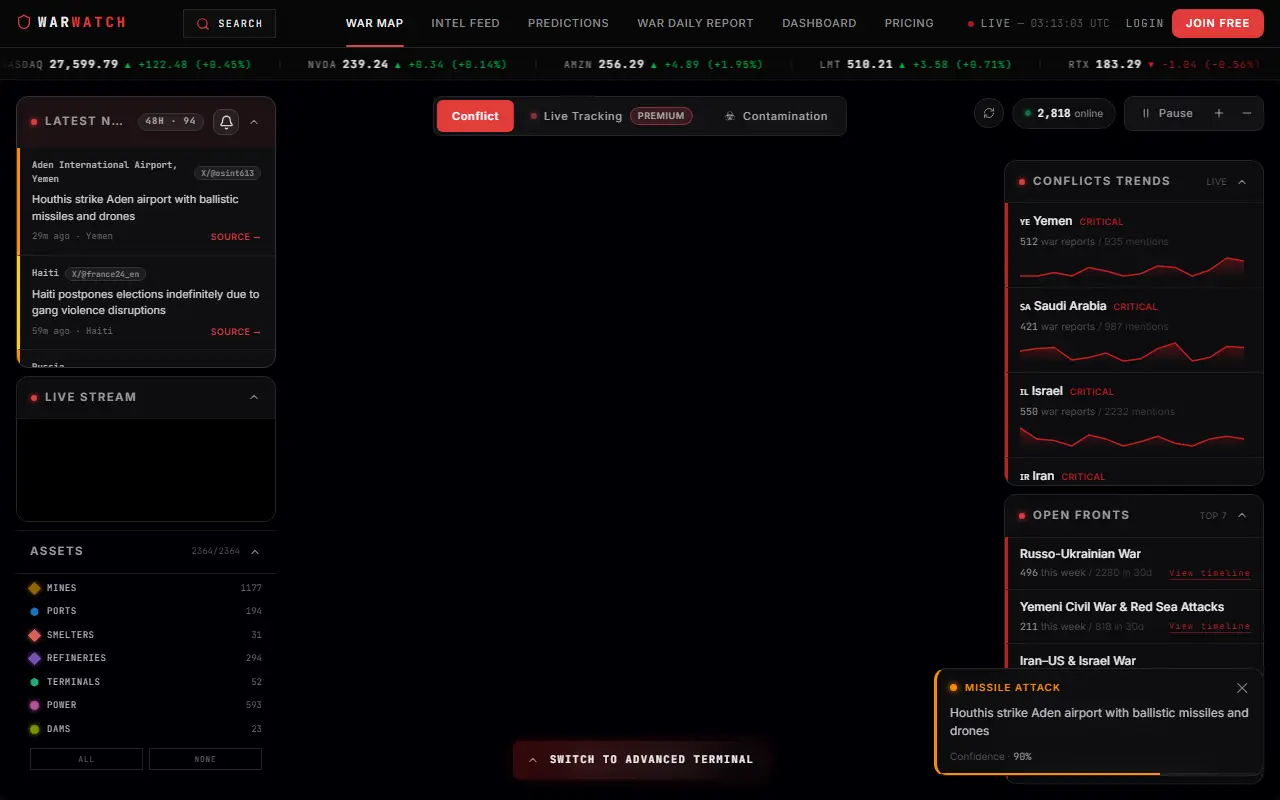
About War-watch
WarWatch is a live war map built around an interactive 3D globe. It collects reports from 45 news and open-source intelligence sources, such as wire services, regional newspapers, Telegram channels judged reliable and geolocated incident feeds, and scores each country by how much conflict reporting it generates. Clicking a country opens a dossier, a marker shows an alert, and a strait opens a transit monitor.
The site is explicit about what the score means: severity reflects the volume of conflict reporting per country over a 30-day window, not casualties or territory, so a heavily covered country can outrank one where more happens quietly. A table lists each country with a color band, counts of war reports and all mentions, and a trend such as cooling, steady or escalating. Daily briefs for each country are written only from the last seven days of that country's conflict reporting. Other sections are an intel feed, predictions, a war daily report and a dashboard. The site offers a free sign-up and has a separate pricing page.
Key features
- Interactive 3D globe of active conflict zones
- Country severity scores over a 30-day window
- Trend labels such as cooling or escalating
- Real-time alerts shown as globe markers
- Strait transit monitors
- Sourced country dossiers
- Daily briefs per country
- Searchable intel feed
Good fit for
- Following which regions dominate conflict coverage
- Monitoring shipping straits for transit news
War-watch: questions and answers
- What is War-watch used for?
- War-watch is an interactive 3D globe that maps armed conflict, scoring countries by conflict reporting from 45 news and OSINT sources, with alerts, dossiers and daily briefs. It is a good fit for following which regions dominate conflict coverage and monitoring shipping straits for transit news.
- Is War-watch free?
- Yes. War-watch has a free plan, and paid plans start at €4.99 per month.
- Is War-watch open source?
- No. War-watch is proprietary (closed-source) software and can't be self-hosted. In the BI & Dashboards category, open-source options include World Monitor, Redash and DataEase.
- What are some alternatives to War-watch?
- Other SaaS products in the BI & Dashboards category include Elevum, Splot and Advantora Insights.
Open-source alternatives to War-watch
See all
World Monitor
BI & Dashboards
Real-time global intelligence dashboard. AI-powered news aggregation, geopolitical monitor
AGPL-3.0★ 88k
Redash
BI & Dashboards
Make Your Company Data Driven. Connect to any data source, easily visualize, dashboard and
BSD-2-Clausevs Data Studio★ 29k
DataEase
BI & Dashboards
🔥 人人可用的开源 BI 工具,数据可视化神器。An open-source BI tool alternative to Tableau.
OSSvs Tableau★ 25k
Datasette
BI & Dashboards
An open source multi-tool for exploring and publishing data
Apache-2.0★ 12k
Evidence
BI & Dashboards
Evidence is an open source, code-based alternative to drag-and-drop BI tools. Build polish
MITvs Tableau★ 7k
Lightdash
BI & Dashboards
Agentic BI. Analytics at the speed of code ⚡️
OSSvs Looker★ 6.2k
SaaS alternatives to War-watch
See all
Elevum
BI & Dashboards
Monitors Costa Rican public tenders and alerts companies to matching bids
SaaS
Splot
BI & Dashboards
Reports data from tools like Jira, PostHog and PostgreSQL into Slack and similar messaging apps
SaaS
Advantora Insights
BI & Dashboards
AI data analysis for Excel, CSV and PDF files that exports PDF reports and PowerPoint decks
SaaS
AgencyAnalytics
BI & Dashboards
Reporting and dashboard platform for marketing agencies
SaaS
Agents Metrics
BI & Dashboards
Helps brokerage managers track and compare agent production and spot real estate recruiting leads
SaaS
AI Dashboard Gen
BI & Dashboards
Generates interactive dashboards from your data with AI
SaaS