
About Pulse
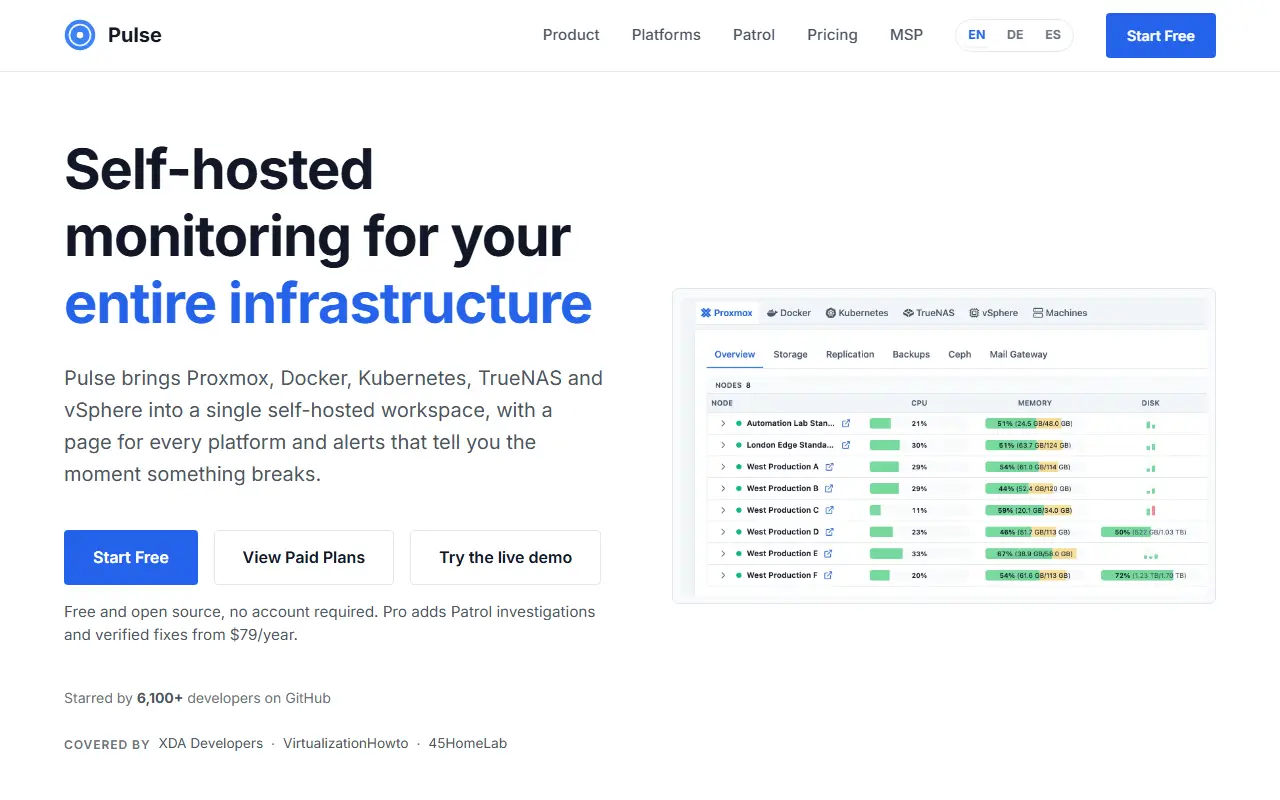
Pulse is a self-hosted monitoring dashboard that brings Proxmox VE, Proxmox Backup Server and Mail Gateway, Docker and Podman, Kubernetes, TrueNAS, Linux, Windows and macOS machines and early-access VMware vSphere into one workspace. It merges current state, history, alerts, visibility into recoveries and scheduled health checks, and does not require a conventional enterprise monitoring stack.
Its alerts and Pulse Patrol aim to find problems when nobody is watching, such as failed backups, capacity pressure, restart loops, unhealthy containers and clock drift. Each platform gets familiar dedicated views, all sharing a single resource model for search, alerts, history and investigation. Coverage includes Proxmox nodes, guests, storage, replication and Ceph, Docker hosts, Compose projects and Swarm services, Kubernetes workloads, and TrueNAS pools, datasets and snapshots.
The project stresses operator control: stored credentials are encrypted, API tokens have limited scopes, agent commands start disabled and governed fixes need an approval path. Pulse is written in Go and TypeScript, licensed under MIT, and offers a live demo. It suits homelab owners and MSPs who run Proxmox and containers.
Key features
- Proxmox VE, PBS and PMG monitoring
- Docker, Podman and Kubernetes views
- TrueNAS pools, datasets and snapshots
- Alerts for failed backups and capacity pressure
- AI-assisted Pulse Patrol health checks
- Encrypted credentials and scoped API tokens
- Unified agent for host metrics
Good fit for
- →Monitoring a Proxmox homelab
- →Spotting silent backup failures
- →One dashboard across Docker and Kubernetes hosts
- Tags
- monitoring
- proxmox
- docker
- kubernetes
- truenas
- homelab
- alerts
- self-hosted
- vsphere
- golang
Pulse: questions and answers
- What is Pulse used for?
- Pulse is self-hosted monitoring for Proxmox, Docker, Kubernetes, TrueNAS, ordinary machines and vSphere, with alerts and AI-assisted health checks. It is a good fit for monitoring a Proxmox homelab, spotting silent backup failures, and one dashboard across Docker and Kubernetes hosts.
- Is Pulse open source?
- Yes. Pulse is open source under the MIT licence. Its source code is on GitHub at rcourtman/Pulse and is written mainly in Go.
- Is Pulse free?
- Yes. Pulse is open source, so the software itself is free to use. Paid plans are also available, starting at $149 per month.
- Can I self-host Pulse?
- Yes. Pulse can be self-hosted on your own server or infrastructure.
- What are some alternatives to Pulse?
- Similar open-source tools in the Monitoring & Observability category include Beszel, Uptime Kuma and Gatus. SaaS products in the same category include Clawwatcher, Groundcover and Nagios XI.
- Is Pulse actively maintained?
- Yes. The most recent commit to Pulse was on 2 October 2026, and the latest release is v6.4.5, published on 30 September 2026. The project has 6.8k stars on GitHub.
Open-source alternatives to Pulse
See all
Beszel
Monitoring & Observability
Lightweight server monitoring with historical data, Docker stats, and alerts.
MIT★ 26k
Uptime Kuma
Monitoring & Observability
A self-hosted monitoring tool
MITvs UptimeRobot★ 92k
Gatus
Monitoring & Observability
Create beautiful, automated status pages with advanced monitoring. Track HTTP, DNS, TCP en
Apache-2.0vs UptimeRobot★ 12k
dashdot
Monitoring & Observability
A simple, modern server dashboard, primarily used by smaller private servers
MIT★ 3.5k
Peekaping
Monitoring & Observability
Open Source Uptime Kuma Alternative
MITvs UptimeRobot★ 1.2k
Statping
Monitoring & Observability
Status Page for monitoring your websites and applications with beautiful graphs, analytics
GPL-3.0vs Statuspal★ 7.3k
SaaS alternatives to Pulse
See all
Clawwatcher
Monitoring & Observability
Observability for OpenClaw agents with token and cost tracking and anomaly alerts
SaaS
Groundcover
Monitoring & Observability
eBPF-based observability that keeps collected data inside the customer's cloud
SaaS
Nagios XI
Monitoring & Observability
Commercial monitoring platform for servers, networks and applications built on Nagios
SaaS
Sematext
Monitoring & Observability
Monitoring and log management cloud service for apps and infrastructure
SaaS
Amazon CloudWatch
Monitoring & Observability
AWS service for metrics, logs, alarms and dashboards
SaaS
AppDynamics
Monitoring & Observability
Cisco application performance monitoring that maps technical metrics to business impact
SaaS