TrackMedia
 TrackRev

Prometheus
A CNCF metrics monitoring system and time series database that scrapes targets, evaluates alert rules and offers the PromQL query language.
- GitHub stars
- 68k
- Last commit
- yesterday
- Latest release
- v3.16.0
- Licence
- Apache-2.0
- Self-hosted
- Yes
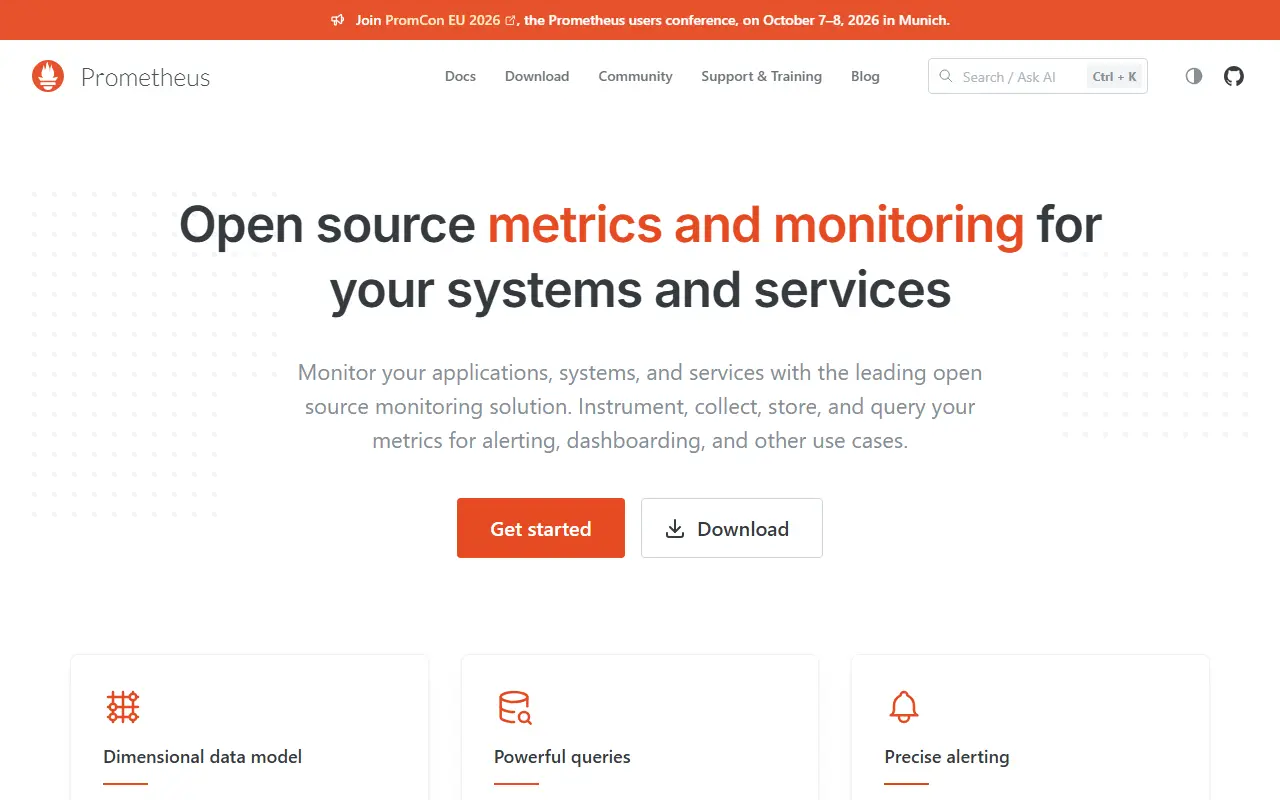
Prometheus is a systems and service monitoring tool and time series database, and a project of the Cloud Native Computing Foundation. It collects metrics from configured targets at set intervals, evaluates rule expressions, shows the results and can fire alerts when conditions are met.
Its data model is multi-dimensional: a time series is identified by a metric name plus key and value labels, and PromQL is the query language built to exploit that structure. Collection uses an HTTP pull model, with a gateway available for pushing metrics from short-lived batch jobs, and targets are found through service discovery or static configuration. Single server nodes are autonomous with no dependence on distributed storage, and hierarchical and horizontal federation is supported.
Prometheus is written in Go under the Apache-2.0 license and ships as precompiled binaries and Docker images on Quay.io and Docker Hub, or can be built from source. It has no hosted service of its own and is typically run next to exporters and a dashboarding tool such as Grafana, which suits cloud-native and Kubernetes environments.
Key features
- Multi-dimensional time series data model
- PromQL query language
- HTTP pull-based metric collection
- Service discovery for targets
- Alerting rules evaluated on collected metrics
- Federation across Prometheus servers
- Push gateway for batch jobs
Pricing: Free and open source under the Apache-2.0 license.