#1
A framework from Microsoft for end-to-end web testing and browser automation across Chromium, Firefox and WebKit using one API.
- GitHub stars
- 100k
- Last commit
- today
- Latest release
- v1.65.0
- Licence
- Apache-2.0
- Self-hosted
- Yes
playwright.dev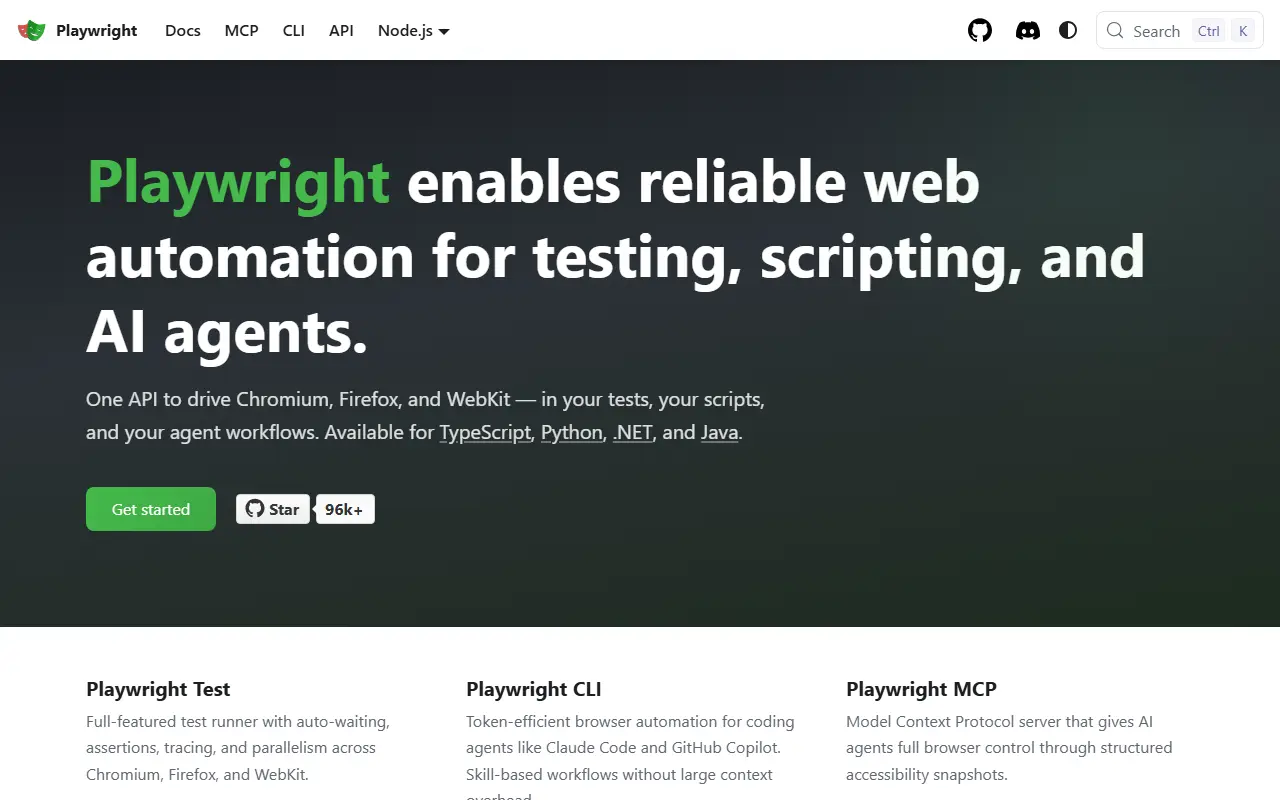
Playwright is an open-source framework for testing and automating web applications. A single API drives Chromium, Firefox and WebKit, so the same script or test can cover all three engines. It is used for end-to-end testing, for scripted browser tasks and, increasingly, as a tool that AI agents call to operate a browser.
The bundled Playwright Test runner executes tests in parallel with a fresh browser context per test, which gives isolation without the cost of launching a new browser. Locators mirror how users see the page, actions wait automatically until elements are ready, and assertions retry until they pass. Failures can be investigated with traces that capture screenshots, DOM snapshots, network requests and console output in a Trace Viewer.
Beyond the test runner there is a standalone library for scripts, a CLI aimed at coding agents, an MCP server for LLM-driven automation and a VS Code extension. The code is Apache-2.0 licensed and runs on your own machines and CI servers, with no hosted service required.
Key features
- One API for Chromium, Firefox and WebKit
- Auto-waiting actions and retrying assertions
- Parallel tests with isolated browser contexts
- Trace Viewer with DOM snapshots and network logs
- Locators that mirror how users see pages
- MCP server and CLI for AI agents
- VS Code extension for authoring tests
Pricing: Free and open source under the Apache-2.0 license.
#2
A self-hosted monitoring tool that checks websites, ports, DNS and containers, sends alerts through many notification services and publishes status pages.
- GitHub stars
- 94k
- Last commit
- yesterday
- Latest release
- 2.5.11
- Licence
- MIT
- Self-hosted
- Yes
uptime.kuma.pet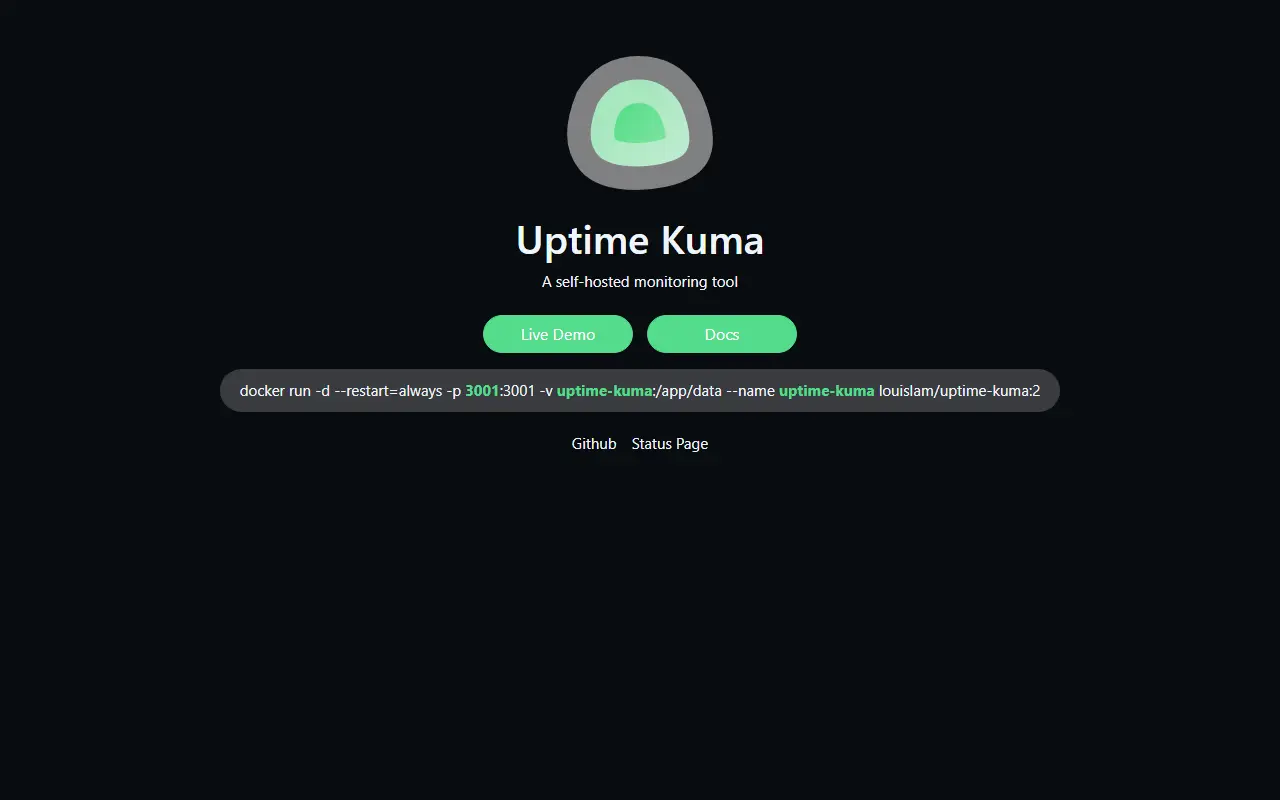
Uptime Kuma is a self-hosted tool that watches whether your services are up and tells you when they are not. You run it on your own server, point it at the endpoints you care about, and it records response times, certificate details and outages in a responsive web dashboard.
Supported monitor types include HTTP(S), TCP, keyword and JSON query checks, WebSocket, ping, DNS records, push-based heartbeats, Steam game servers and Docker containers, with checks as frequent as every 20 seconds. Alerts can go to Telegram, Discord, Gotify, Slack, Pushover, email over SMTP and more than 90 other notification services. You can publish several status pages and map them to your own domains.
It is MIT licensed and mainly distributed as a Docker image, with a Docker Compose setup and a non-Docker route that uses Node.js and pm2. Extras include proxy support, two-factor authentication, multiple UI languages and ping charts. Network file systems such as NFS are not supported for its data directory.
Key features
- Monitors HTTP, TCP, DNS, ping and Docker containers
- Checks as often as every 20 seconds
- Alerts through 90+ notification services
- Multiple status pages on custom domains
- Certificate details and ping charts
- Two-factor authentication and proxy support
Pricing: Free and open source under the MIT license; you host it yourself.
#3
A developer-oriented health dashboard and status page that checks services over HTTP, ICMP, TCP and DNS and sends alerts to many chat and paging tools.
- GitHub stars
- 13k
- Last commit
- yesterday
- Latest release
- v5.38.0
- Licence
- Apache-2.0
- Self-hosted
- Yes
- Hosted version
- Available
gatus.io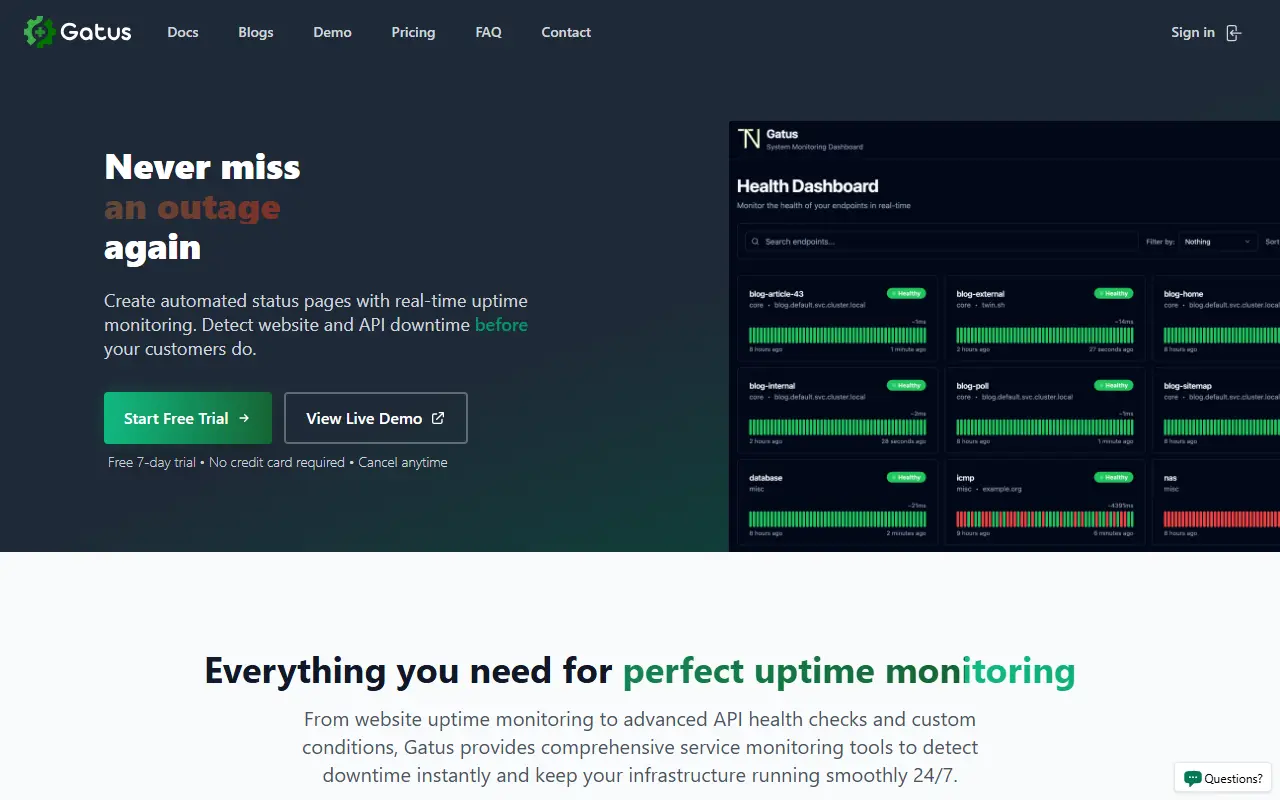
Gatus is a developer-oriented health dashboard and status page for monitoring services. Each endpoint is checked using HTTP, ICMP, TCP or DNS queries, and the result is evaluated against a list of conditions covering values such as the status code, response time, certificate expiration and response body.
Checks can be paired with alerting through Slack, Microsoft Teams, PagerDuty, Discord, Twilio and many more providers, and the documentation lists dozens of alert integrations, from email and Matrix to Opsgenie and ntfy. Configuration is done in a file, with support for external endpoints, announcements, suites in alpha, storage options, tunneling and a web UI. Incident support is part of the pitch.
Gatus is written in Go and licensed under Apache-2.0, and it is easy to deploy with Docker or in Kubernetes. The author runs it in his own cluster to watch core applications. Anyone who prefers not to run it can use the managed offering at gatus.io.
Key features
- HTTP, ICMP, TCP and DNS health checks
- Conditions on status, latency and certificates
- Alerts to Slack, Teams, PagerDuty and more
- Public status page and dashboard
- Simple file-based configuration
- Docker and Kubernetes deployment
Pricing: Free and open source under Apache-2.0; a managed option is available at gatus.io.
#4
A developer-focused platform for error tracking and performance monitoring that helps teams detect, trace and fix issues, with SDKs for most programming languages.
- GitHub stars
- 46k
- Last commit
- today
- Latest release
- 26.10.1
- Self-hosted
- Yes
- Hosted version
- Available
sentry.io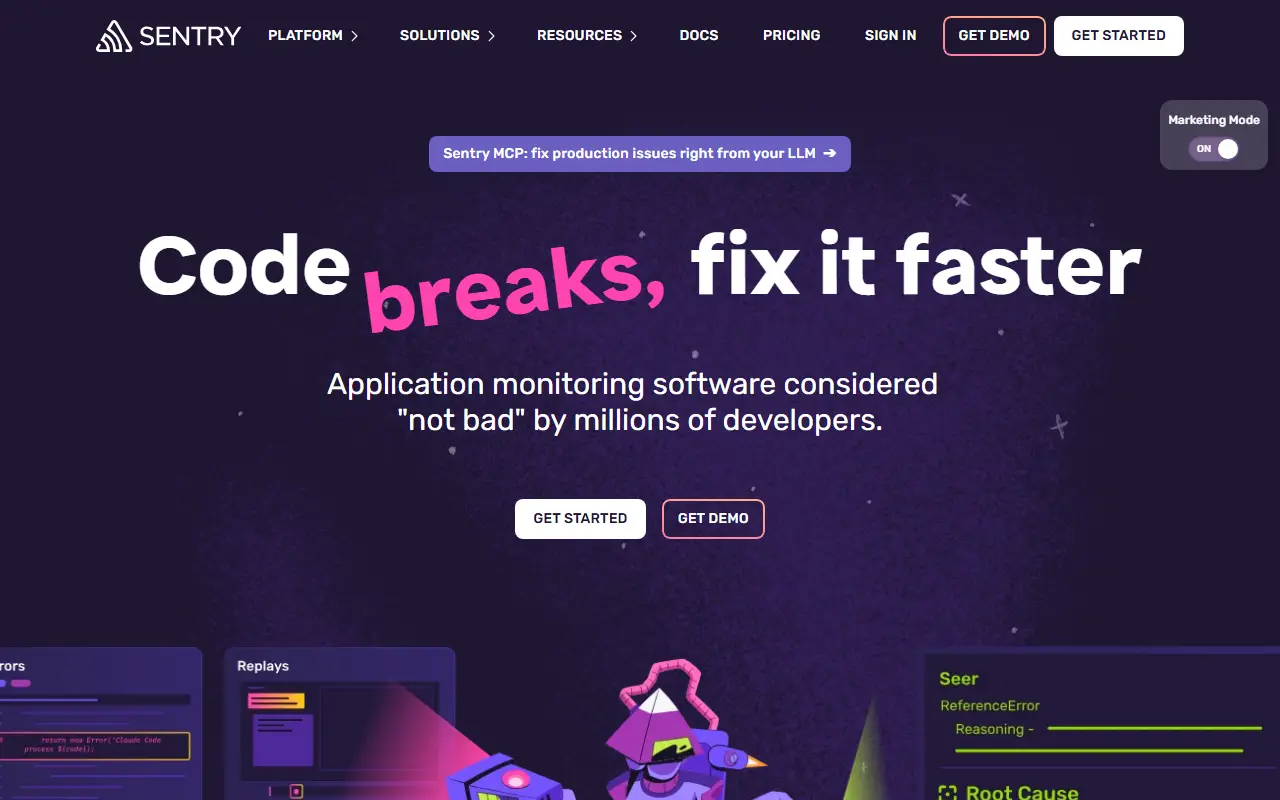
Sentry is a debugging platform that helps developers detect, trace and fix problems in their applications. It collects crash reports and errors from running software, groups them into issues, and adds the context needed to understand what happened, alongside performance monitoring for slow requests and transactions.
Integration happens through official SDKs covering web, mobile, desktop, server and game platforms, from JavaScript, Python and PHP to Go, Rust, Java, Kotlin, Swift, Flutter, Unity, Unreal Engine and Godot. The server itself is a Python application built on Django, and topics also mention CSP report collection and application performance monitoring.
Sentry is source available, and its license is listed as 'Other' on GitHub rather than a standard open-source license. It can be run on your own infrastructure, and the company also operates the hosted service at sentry.io. It is used by engineering teams of all sizes as a first stop when something breaks in production.
Key features
- Error and crash tracking
- Application performance monitoring
- Official SDKs for many languages and frameworks
- Issue grouping with debugging context
- CSP report collection
- Self-hosted or hosted deployment
Pricing: Free Developer plan for one user. Team is $26 per month and Business $80 per month when billed annually, with unlimited users; Enterprise is custom. Usage above the included quota is billed pay-as-you-go.
#5
k6 is an open-source load testing tool where tests are written as JavaScript code and run on a fast Go engine.
- GitHub stars
- 32k
- Last commit
- yesterday
- Latest release
- v2.3.0
- Licence
- AGPL-3.0
- Hosted version
- Available
grafana.com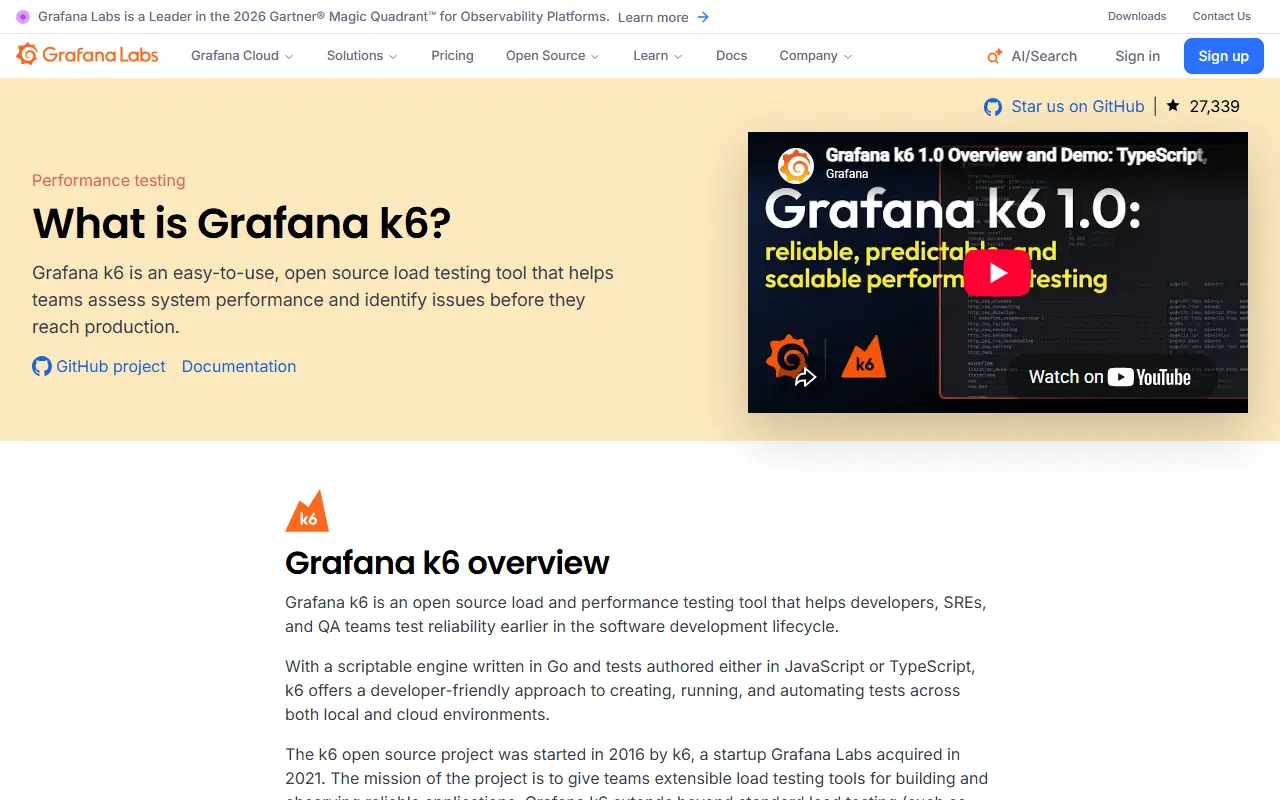
k6 is a load-testing tool for developers and testers, described as unit testing for performance. Test scripts are written in JavaScript and executed by an embedded engine written in Go, combining scripting familiarity with efficient load generation. It is maintained under the Grafana organization and released under the AGPL-3.0 license.
Because tests are code, scripts can be modularized, version controlled and run from the command line, in CI or across a Kubernetes cluster. k6 supports HTTP, WebSockets, gRPC and browser protocols, and an extension ecosystem adds more. Results can be summarized or exported as granular metrics to the service of your choice, and the tool integrates natively with Grafana Cloud for test execution and analysis. For people who prefer not to write code, k6 Studio is a desktop app that generates scripts.
Key features
- Load tests written as JavaScript code
- Go engine for efficient traffic generation
- HTTP, WebSocket, gRPC and browser protocols
- Extension ecosystem for added capabilities
- Flexible metrics export to other services
- k6 Studio desktop app for no-code scripts
Pricing: The Grafana Cloud page, which covers k6 performance tests, lists a free plan, Pro from $19 per month plus usage, and Enterprise starting at a $25,000 per year spend commit.
#6
Kibana is the web interface for querying, visualizing and managing data stored in Elasticsearch, used for dashboards, observability and analytics.
- GitHub stars
- 21k
- Last commit
- yesterday
- Latest release
- v9.5.6
- Self-hosted
- Yes
- Hosted version
- Available
elastic.co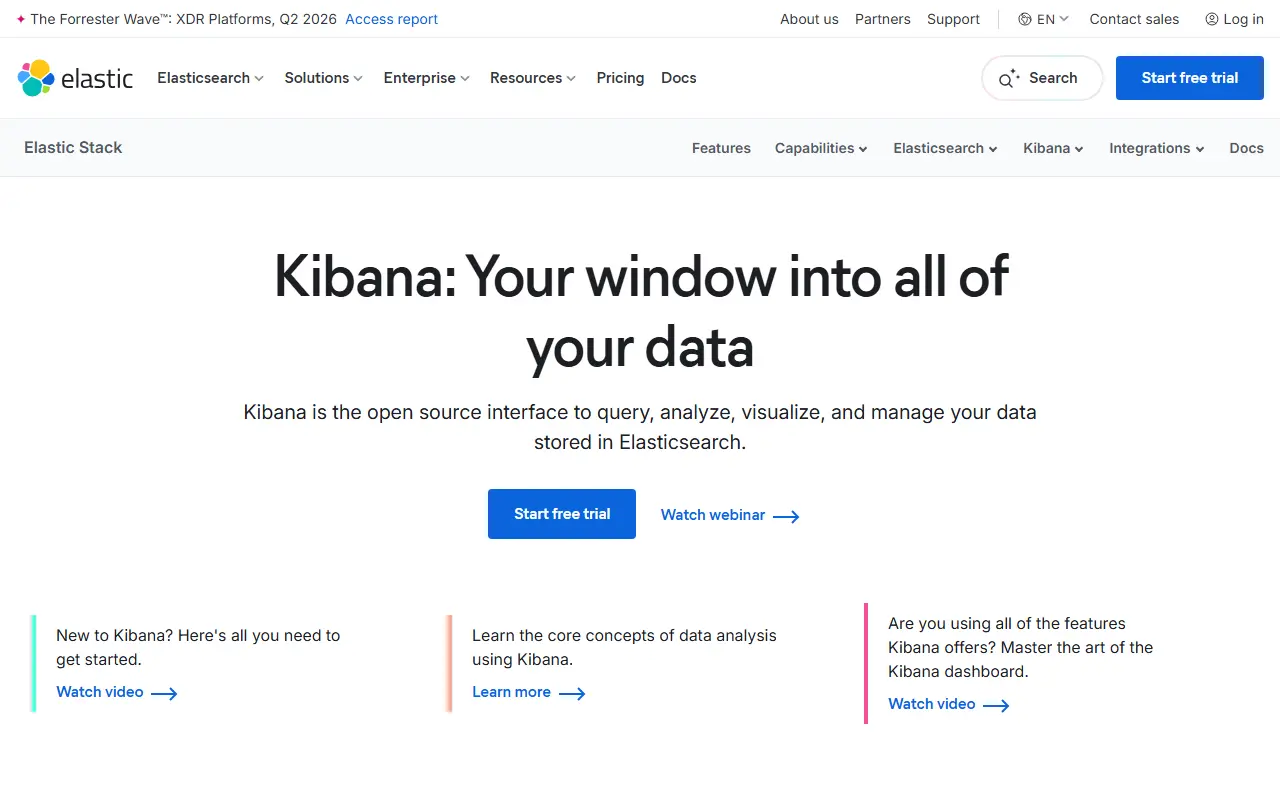
Kibana is the user interface that sits on top of Elasticsearch. It lets people query, analyze, visualize and manage the data stored there, turning indexes into charts, metrics views and dashboards. It is part of the Elastic Stack and is commonly used for log analysis, observability and general analytics work.
Teams build visualizations and assemble them into shared dashboards, explore documents with search, and use the interface to manage parts of an Elasticsearch deployment. The project advises running Kibana and Elasticsearch at the same version, with major versions required to match, because mismatches can cause problems and support may ask for an upgrade first.
The code is written in TypeScript. The repository lists its license as 'Other' rather than a standard SPDX identifier, so the license files should be read for the exact terms. Kibana can be downloaded and run on your own infrastructure, and Elastic also offers a hosted version through its Cloud service.
Key features
- Query and explore Elasticsearch data
- Visualizations and metrics charts
- Shared dashboards for monitoring
- Observability views for logs and metrics
- Management tools for Elasticsearch data
- Hosted option through Elastic Cloud

A cron job and background task monitoring service that alerts you when expected pings do not arrive, available as a hosted service or to self-host.
- GitHub stars
- 11k
- Last commit
- 3 days ago
- Latest release
- v5.0.3
- Licence
- BSD-3-Clause
- Self-hosted
- Yes
- Hosted version
- Available
healthchecks.io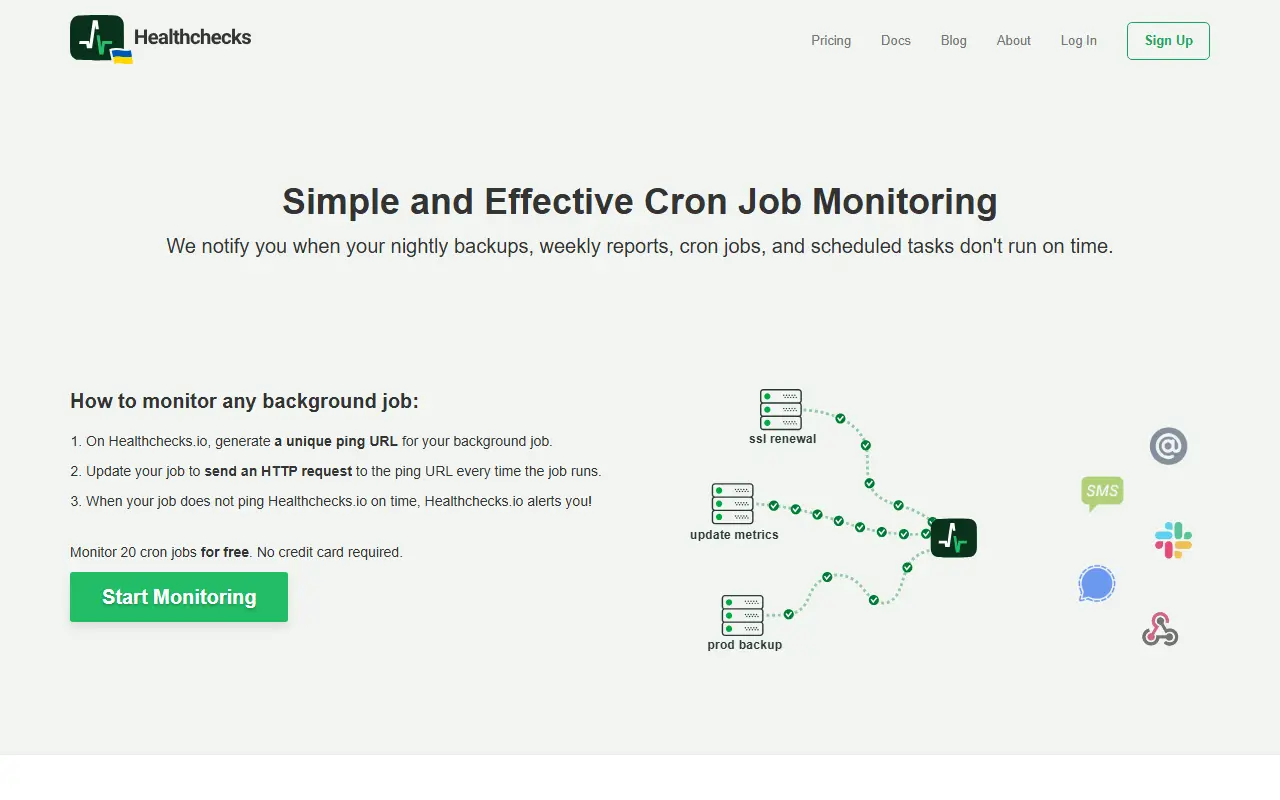
Healthchecks is a monitoring service for cron jobs and scheduled tasks. Each job sends a ping over HTTP or email when it runs, and Healthchecks raises an alert whenever an expected ping fails to show up in time. This catches silent failures of backups, imports and other background work that would otherwise go unnoticed.
Every check has a period, which is the expected time between pings, and a grace time, which says how long to wait before alerting, or it can follow a cron expression instead. The product includes a live web dashboard, an API, more than 25 notification integrations, monthly email reports, WebAuthn two-factor authentication and team features such as projects, members and read-only access. Status badges with hard-to-guess public URLs can be embedded in READMEs or status pages.
Healthchecks is written in Python with Django and uses PostgreSQL, MySQL or MariaDB. It is licensed under the BSD 3-Clause licence and can be self-hosted, with a Dockerfile and prebuilt Docker images provided, or used as the hosted service at healthchecks.io.
Key features
- Ping-based cron job monitoring
- Period and grace time settings
- Cron expression schedules
- 25+ notification integrations
- Live dashboard and API
- Team projects and read-only access
- Public status badges
Pricing: Free Hobbyist plan monitors 20 jobs. Paid plans cost $5 (Supporter), $20 (Business) and $80 (Business Plus) per month; paying annually saves 20%.
#8
An open-source status page and uptime monitoring platform where monitors and pages are declared as code in YAML or Terraform, available managed or self-hosted.
- GitHub stars
- 9.3k
- Last commit
- today
- Licence
- AGPL-3.0
- Self-hosted
- Yes
- Hosted version
- Available
openstatus.dev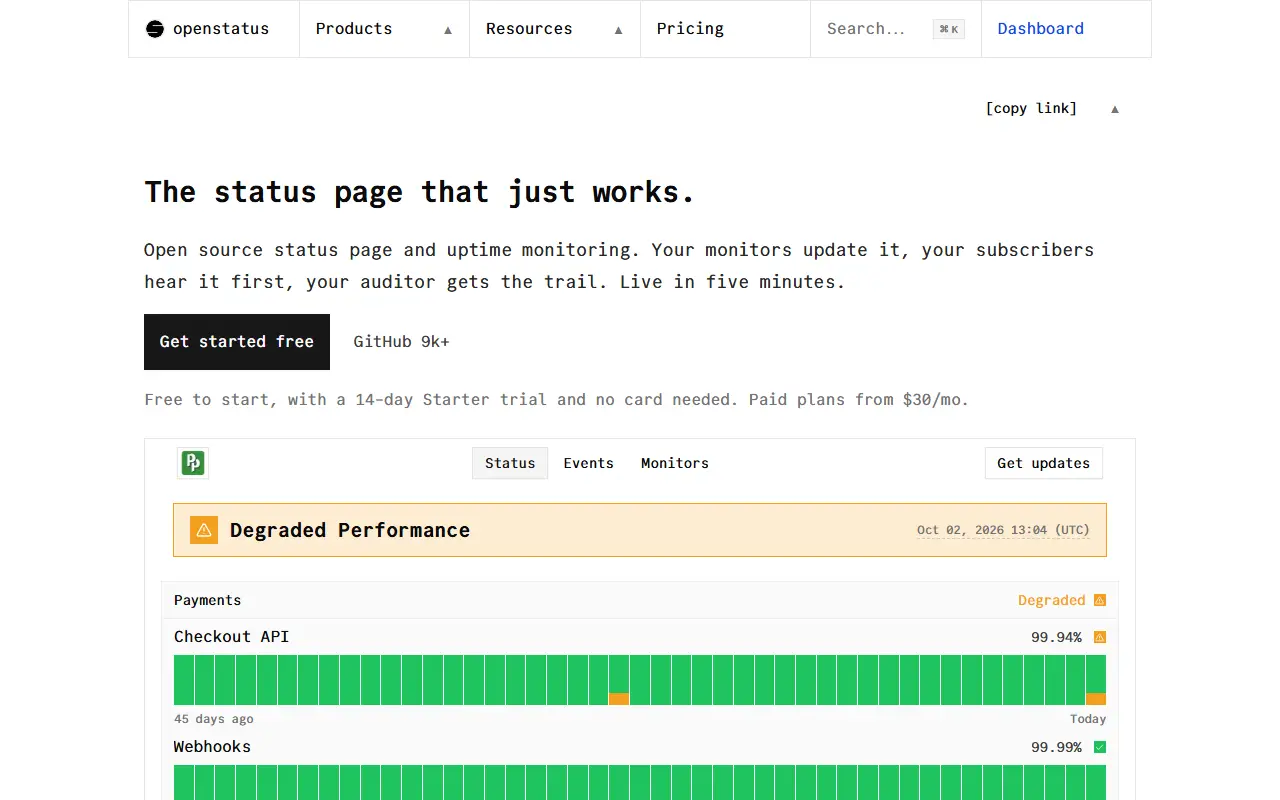
Openstatus is an uptime monitoring and status page platform, open source and built around infrastructure as code. Monitors, status pages and alert channels are written in YAML or Terraform and applied through the CLI or CI, and they can also be operated by AI assistants such as Claude, ChatGPT or Cursor through an MCP server.
The platform combines status pages and monitoring in one tool. Status pages can use custom domains and password protection, schedule maintenance windows, and notify subscribers by email, RSS or webhooks. Monitoring checks servers, websites and APIs from 28 regions across three cloud providers in parallel, with alerts through Slack, Discord, PagerDuty, email and more. Incident management lets teams open and manage incidents from the dashboard or Slack, with severity, a commander and a full timeline.
Openstatus is available as a managed service or can be self-hosted under the AGPL-3.0 licence, and private locations run in a very small Docker image. The README highlights flat pricing with unlimited members, with a JSON CLI, typed API and audit log for every change. It suits engineering teams that want monitoring configured in version control.
Key features
- Monitors and status pages as code
- YAML and Terraform configuration
- Uptime checks from 28 global regions
- Custom domains and maintenance windows
- Incident management with timelines
- MCP server and JSON CLI
- Subscriber notifications by email and RSS
Pricing: Free Hobby plan with one monitor. Starter is $30, Pro $100 and Scale $500 per month, with 2 months free on annual billing and a 14-day Starter trial. Enterprise is custom.
#9
An open-source platform that combines uptime monitoring, status pages, on-call, incident management, logs, traces, metrics and error tracking in one self-hostable app.
- GitHub stars
- 7.8k
- Last commit
- today
- Latest release
- 14.0.108
- Self-hosted
- Yes
- Hosted version
- Available
oneuptime.com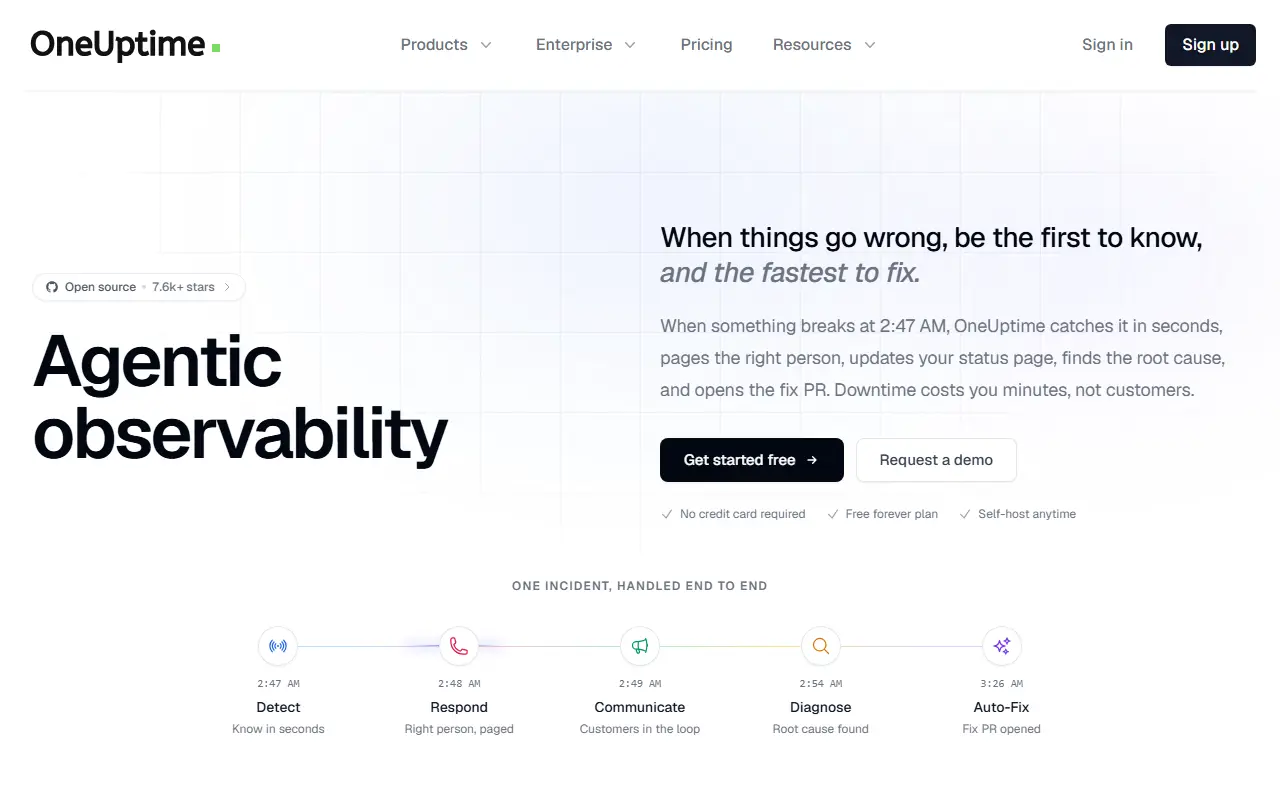
OneUptime is an open-source monitoring and observability platform that aims to replace a shelf of separate SaaS tools. It covers uptime monitoring, status pages, on-call and alerting, incident management, logs, traces, metrics, APM and error tracking in one application, and adds AI-assisted features such as helping find the root cause and proposing a fix.
Its README maps each module to the tools it can replace: Pingdom and UptimeRobot for uptime checks across websites, APIs, ports, SSL and DNS, StatusPage.io for branded public and private status pages, PagerDuty and Opsgenie for schedules, escalation policies and SMS, call, push or Slack alerts, Incident.io for declaring and triaging incidents with post-mortems, Datadog and New Relic for traces and dashboards, Loggly for logs, and Sentry for exceptions.
The Community Edition is open source under Apache 2.0 and free to self-host, and OneUptime Cloud offers a free-forever plan with no credit card. It is written in TypeScript. It suits small and mid-sized engineering teams that want one platform for reliability work rather than integrating many vendors.
Key features
- Uptime monitoring for sites, APIs and ports
- Branded public and private status pages
- On-call schedules and escalation policies
- Incident management with post-mortems
- Logs, traces, metrics and APM
- Error tracking with stack traces
Pricing: Free plan with one status page. Growth is $22 and Scale $99 per month with 14-day trials; Enterprise is custom. Monitors, SMS, telemetry and AI use are billed on top.
#10
sitespeed.io tests and monitors website speed using real browsers and reports Core Web Vitals; it is open source and runs on your own infrastructure.
- GitHub stars
- 5.1k
- Last commit
- yesterday
- Latest release
- v43.0.0
- Licence
- MIT
- Self-hosted
- Yes
sitespeed.io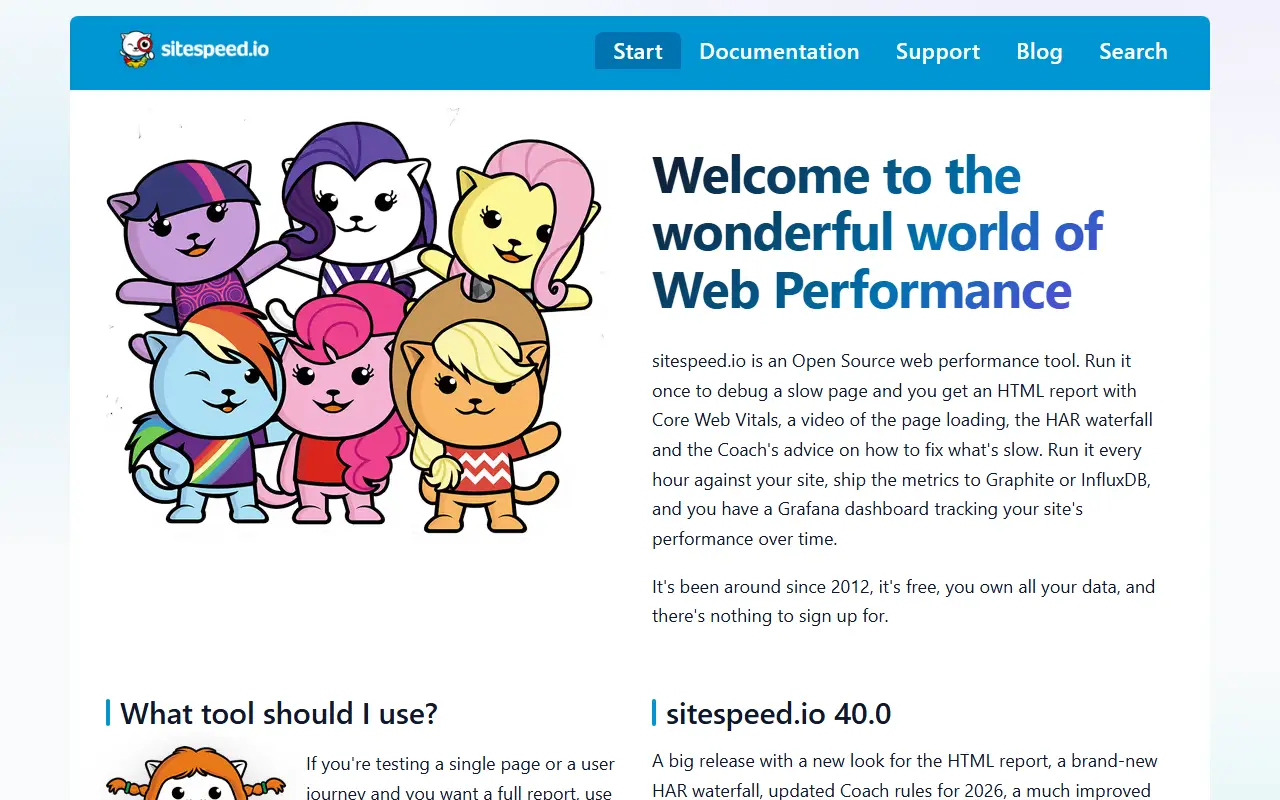
sitespeed.io is open-source software for measuring web performance. You run it against a page or a set of pages, and it drives real browsers to measure how fast they load, producing an HTML report that includes Core Web Vitals and a video recording, so you can debug a slow page or compare changes over time.
It can be installed with Docker or Node.js, supports basic and advanced configuration, and includes guidance for mobile testing. Teams run it from CI or on a schedule to monitor performance continuously and catch regressions. The repository lists metrics, performance analysis and dashboards among its topics, and the project is active on Bluesky and Mastodon with a public changelog.
sitespeed.io is written in JavaScript and licensed under MIT. It runs on your own machines or servers, so no hosted account is needed. It suits front-end developers, performance engineers and operations teams that want self-controlled performance budgets and monitoring.
Key features
- Real browser performance testing
- HTML reports with Core Web Vitals
- Video recordings of page loads
- Docker and Node.js installation
- Mobile testing support
- Continuous monitoring from CI or schedules
Pricing: Free and open source under the MIT license.
Checkly alternatives: questions
- What is the best open-source alternative to Checkly?
- Playwright is the top-ranked open-source alternative to Checkly on Enlisted: A framework from Microsoft for end-to-end web testing and browser automation across Chromium, Firefox and WebKit using one API. Other strong options are Uptime Kuma, Gatus, Sentry and k6.
- What are the best commercial alternatives to Checkly?
- Pingdom, Dead Man's Snitch, Uptime.com, Atlassian Statuspage and Dotcom-Monitor are among the hosted, closed-source alternatives to Checkly listed on Enlisted, which lists 40 in total. Compare their pricing and features on each tool page.
- Are these Checkly alternatives free?
- All 11 are open source, so the code is free to use under its licence, and all of them can be self-hosted on your own server or computer. 7 also offer a paid or managed cloud version if you'd rather not host it yourself.
- How is this list of Checkly alternatives ranked?
- By a score built from GitHub stars, star growth over the last 30 days and how recently the code changed. 10 of these projects shipped code in the last 30 days. Data is refreshed daily, and nobody can pay to move up.
 TrackMedia
 TrackRev