7,363 open-source and SaaS tools, with GitHub stats refreshed every day.

8 alternatives ranked by real activity

Open-source Looker alternatives

A curated, ranked list of the 8 best open-source alternatives to Looker.

The best open-source alternative to Looker is Superset. If that doesn't suit you, other good options are Metabase, Cube, Evidence and Lightdash.

Looker alternatives are mainly BI & dashboard tools, but some are also data pipeline & ETL tools. 8 of them shipped code in the last 30 days, 8 can be self-hosted, and 5 use a permissive licence.

Last updated October 2, 2026 · ranked by GitHub stars, growth and recent commits

Superset

A web-based business intelligence platform from the Apache project with a no-code chart builder, SQL editor and dashboards that connects to most SQL databases.

GitHub stars
75k
Last commit
today
Latest release
6.1.0
Licence
Apache-2.0
Self-hosted
Yes
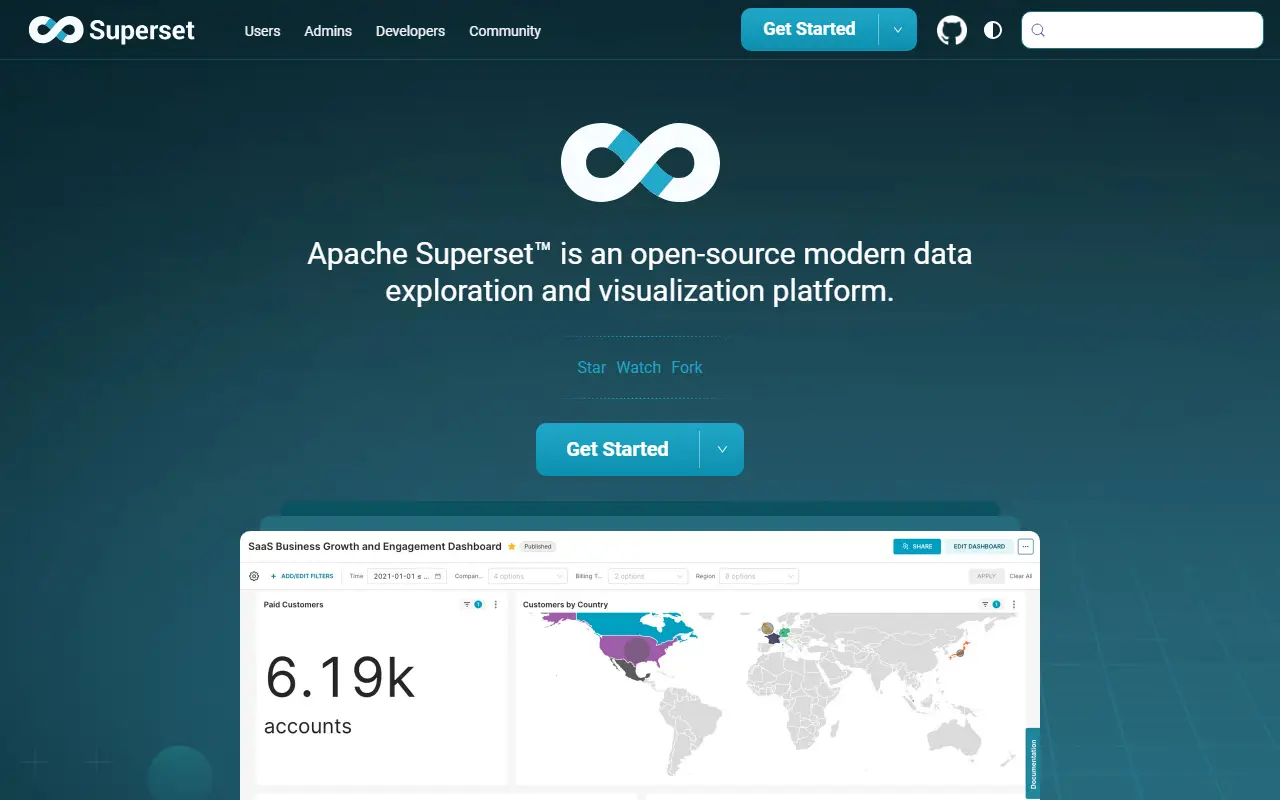
superset.apache.orgSuperset homepage screenshot

Apache Superset is a data exploration and visualization platform that runs as a web application. Analysts and business users can connect it to a database, build charts without code, assemble them into dashboards and share them, so it can augment or replace proprietary business intelligence tools for many teams.

The no-code chart builder sits next to a web-based SQL editor for advanced queries, and a lightweight semantic layer lets teams define reusable dimensions and metrics. Visualizations range from simple bar charts to geospatial views. Superset can query any SQL datastore or engine provided a matching Python database driver and SQLAlchemy dialect exist, including Presto, Trino and Athena. A configurable caching layer reduces database load, and security roles and authentication options are extensible.

The stack is Python with Flask on the back end and React on the front end, under the Apache-2.0 license. A REST API and extension framework allow programmatic control and customization. Documentation is split into guides for users, administrators and developers, and it is a typical choice for organizations that want a self-managed BI layer.

Key features

  • No-code chart builder
  • Web-based SQL editor
  • Shareable interactive dashboards
  • Lightweight semantic layer for metrics
  • Connects to any SQL database with a driver
  • Caching layer and security roles
  • REST API for programmatic customization

Pricing: Free and open source under the Apache-2.0 license.

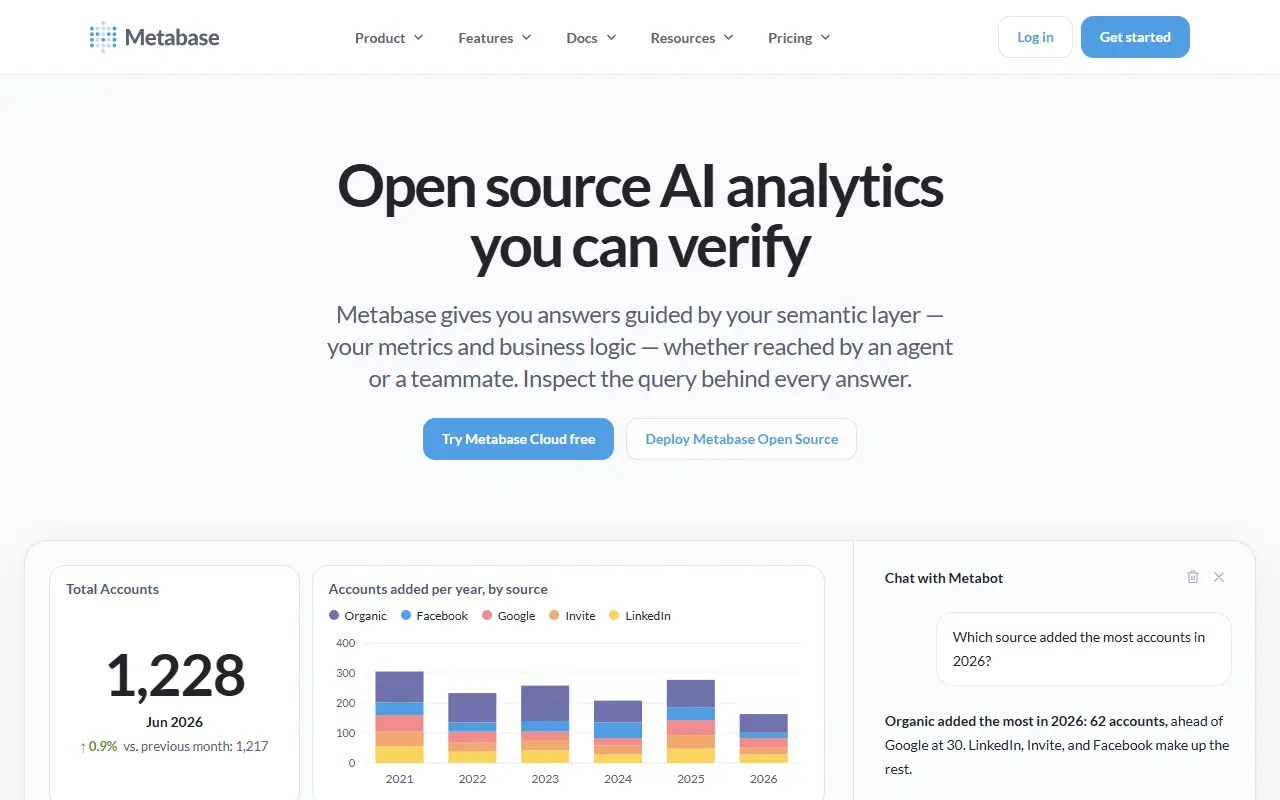
Metabase

An open-source BI and embedded analytics tool for exploring data, building dashboards and asking questions without SQL, self-hosted or through Metabase Cloud.

GitHub stars
50k
Last commit
today
Latest release
v0.63.19
Self-hosted
Yes
Hosted version
Available
metabase.comMetabase homepage screenshot

Metabase is an open-source business intelligence and embedded analytics tool meant for everyone in a company, not only analysts. People can ask questions about their data without knowing SQL, while an SQL editor is available for more complex queries. Written in Clojure, it connects to databases such as PostgreSQL and MySQL.

Its features include interactive dashboards with filters, auto-refresh and custom click behavior, plus documents for long-form analysis that colleagues can comment on. An AI assistant called Metabot helps answer questions and write queries, and you can build your own AI agent against your data. Data Studio supports transforming raw data into analytics-ready tables and defining canonical metrics. Alerts and scheduled dashboard subscriptions go to email, Slack or a webhook, and a Library plus Git integration help version your work.

Metabase can also be embedded in your own product with components for charts, dashboards, a data browser and AI chat, and granular permissions work for internal teams and embedded customers. You can self-host it or use Metabase Cloud, which the project says includes support, backups, upgrades and a free trial. The repository license is listed as 'Other', so review its terms.

Key features

  • Question builder that needs no SQL
  • SQL editor for complex queries
  • Interactive dashboards with filters and auto-refresh
  • Alerts and scheduled subscriptions to email or Slack
  • Embedding of charts and dashboards in apps
  • Granular permissions for teams and customers
  • Metabot AI assistance for queries

Pricing: The open-source edition is free. Cloud Starter is $100 per month and Pro $575 per month with a 14-day trial; extra users cost $6 or $12 per month. Enterprise starts at $20,000 per year.

Cube

An open-source, headless semantic layer where you define metrics and access rules once in code and expose them to BI tools, apps and AI agents through SQL, REST and GraphQL.

GitHub stars
21k
Last commit
today
Latest release
v1.7.48
Self-hosted
Yes
Hosted version
Available
cube.devCube homepage screenshot

Cube Core is an open-source semantic layer. You describe your metrics, dimensions, joins and permissions a single time, as code, and Cube exposes that model through SQL, REST and GraphQL APIs to whatever sits downstream: BI tools, custom applications or AI agents. It is headless, meaning it ships no user interface of its own, which leaves you free to design the analytics experience your product needs.

The project argues that every BI tool already relies on a semantic layer to hide data complexity, but most are proprietary and tied to a single platform. Cube aims to make that layer reusable. It connects to any SQL data source, including warehouses such as BigQuery, Snowflake and Databricks, engines such as Amazon Athena and Presto, and application databases such as Postgres. A built-in relational caching engine delivers fast responses and high concurrency for API requests.

The core is written in Rust and JavaScript, and its license is listed as 'Other' on GitHub, so review the terms for commercial use. Cube can be self-hosted, and the company also offers Cube Cloud. It suits data teams building embedded analytics or wanting consistent metric definitions across tools.

Key features

  • Metrics and dimensions defined as code
  • SQL, REST and GraphQL APIs
  • Headless design with no built-in UI
  • Connects to Snowflake, BigQuery and Databricks
  • Built-in caching engine
  • Access rules for governed data

Pricing: Free forever plan for hobby projects. Starter costs $40 and Premium $80 per developer per month; Enterprise is custom via a demo request.

Evidence

A code-based business intelligence tool where reports are written in SQL and Markdown, an alternative to drag-and-drop BI that can be self-hosted or published on Evidence Studio.

GitHub stars
7k
Last commit
yesterday
Latest release
@evidence-dev/evidence@40.1.8
Licence
MIT
Self-hosted
Yes
Hosted version
Available
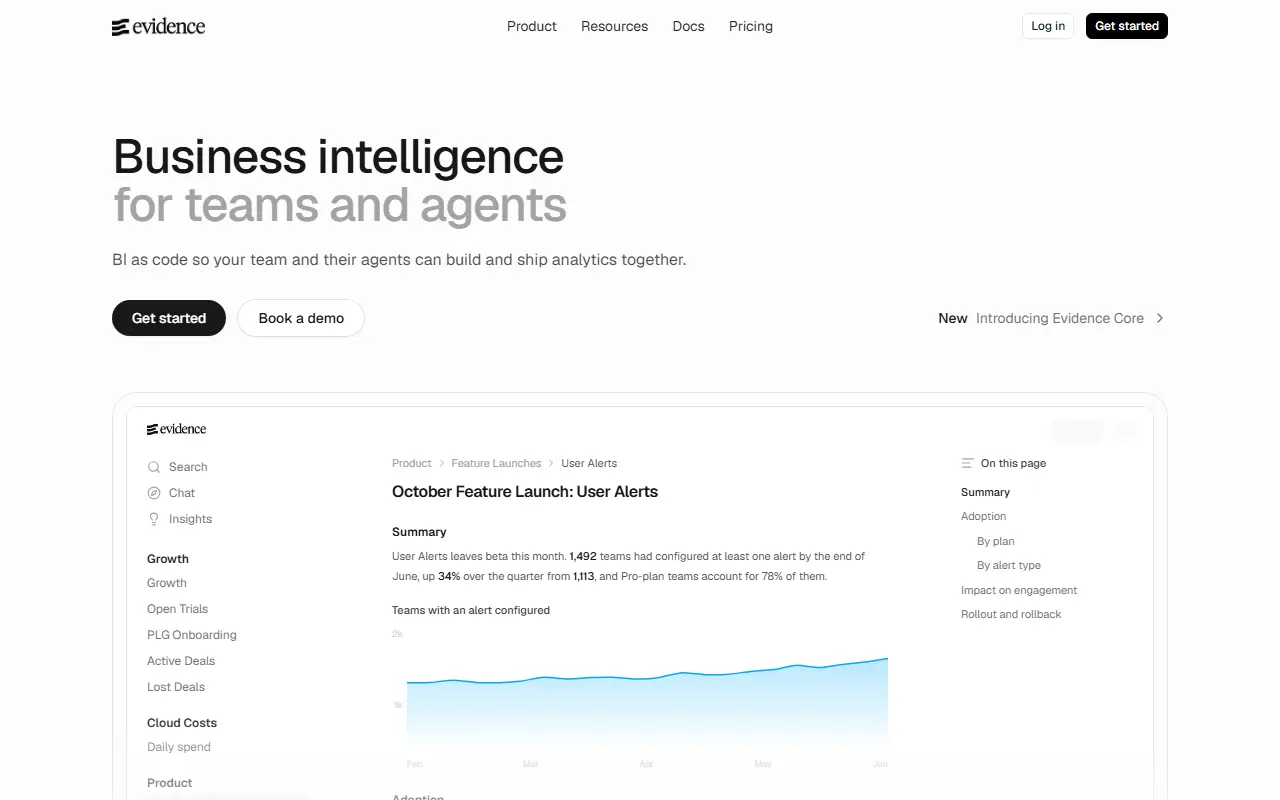
evidence.devEvidence homepage screenshot

Evidence is a code-first business intelligence tool, released as open source, offered in place of drag-and-drop BI products. Reports and dashboards are written as Markdown with SQL queries, which keeps them in version control and lets analysts build interactive data visualizations without a point-and-click builder.

The README calls it agent-ready: you can develop with Evidence's own agent, or locally with coding assistants such as Claude Code or Cursor. Topics mention dbt, DuckDB, Svelte, Tailwind CSS, WebAssembly and self-hosting. A project is created from an installer for macOS, Linux or Windows, and the result can be published on Evidence Studio for hosted reports, or built as a static site and self-hosted on your own infrastructure.

Evidence is written in TypeScript with Svelte and licensed under MIT, and has a Slack community for help. It suits data teams and analysts who are comfortable with SQL and want reports reviewed and deployed like software, rather than assembling dashboards in a GUI.

Key features

  • Reports written in SQL and Markdown
  • Interactive charts and visualizations
  • Works with coding agents like Claude Code
  • Static site output for self-hosting
  • Publishing via Evidence Studio
  • Version-controlled analytics code

Pricing: Evidence Cloud has one flat price for unlimited users: Team is $2,500 per month with a 30-day trial. Enterprise is custom on an annual contract.

Lightdash

Lightdash is an open-source BI platform that defines metrics as code, with dashboards, AI agents and data apps built on a shared context layer.

GitHub stars
6.2k
Last commit
today
Latest release
2.423.2
Self-hosted
Yes
Hosted version
Available
lightdash.comLightdash homepage screenshot

Lightdash is an open-source business intelligence platform that it describes as agentic BI, meant for data teams that want analytics to be shipped like software. Metrics, joins, permissions, business logic and caching are defined once in a context layer, and that layer feeds MCP, SDKs, embedded analytics, data apps, AI agents and dashboards.

Analytics can be built as code: metrics, charts and dashboards live as files that you can edit with coding agents, preview from the Lightdash CLI, validate in CI and review in pull requests. Business users can pose questions in plain English, browse dashboards or build custom data apps, all while governance stays in place. Agents answer from the context layer rather than guessing from raw tables, respect permissions and return queries that can be inspected. The repository topics mention dbt.

Lightdash is written in TypeScript. The vendor recommends starting with Lightdash Cloud, which needs no infrastructure to run, and also offers a live demo, documentation and a sales call. The repository lists its licence as other, so check the terms before self-hosting.

Key features

  • Context layer for metrics and permissions
  • BI as code with CLI and CI validation
  • AI agents that answer from governed metrics
  • Dashboards and custom data apps
  • Embedded analytics, SDKs and MCP
  • dbt-based workflow

Pricing: Self-hosted Open Source edition with community support. Cloud Pro is $3000 per month with unlimited users and a 21-day trial; Enterprise is quoted.

Quary

Open-source business intelligence for engineers, with SQL models, tests, and documentation managed as code and deployed back to your database.

GitHub stars
2.4k
Last commit
19 days ago
Latest release
v0.10.1
Licence
Apache-2.0

Quary is an open-source business intelligence tool aimed at engineers. It connects to a database, lets you write SQL to transform, organize, and document tables, and treats the resulting assets as code that can be tested, reviewed, and versioned. It is written in Rust and released under the Apache-2.0 license.

Assets include sources, which define external data such as database tables, flat files, or APIs through DuckDB, and models, which turn raw data into analysis-ready datasets with SQL so complex logic can be split into smaller steps. The workflow is to test, collaborate, and refactor iteratively through version control, then deploy the organized and documented model back to the database. Charts, dashboards, and reports are listed as in development.

Its topics mention data modeling, ELT, and big data, and the documentation lists supported databases. Quary suits data and analytics engineers who like version-controlled, code-first workflows similar to dbt and want an integrated path from modeling to reporting.

Key features

  • SQL models for transforming and documenting tables
  • Sources from databases, files, and APIs via DuckDB
  • Tests and version-controlled collaboration
  • Deploy models back to the database
  • Assets defined as code
  • Charts and dashboards in development

Pricing: Free and open source under the Apache-2.0 license.
MetricFlow

Semantic layer from dbt Labs that defines metrics in code and compiles requests into optimized, reusable SQL with consistent dimensions and joins.

GitHub stars
1.8k
Last commit
3 days ago
Latest release
v0.213.0
Licence
Apache-2.0
docs.getdbt.comMetricFlow homepage screenshot

MetricFlow is a semantic layer that makes it simpler to define and manage metrics in code. It compiles those metric definitions into clear, reusable SQL, so results stay consistent and accurate when analyzed by relevant attributes, or dimensions. It is maintained by dbt Labs, written in Python, and released under the Apache-2.0 license.

The name reflects its method: a request for a metric is compiled into a dataflow-based query plan that is optimized and translated into engine-specific SQL. It helps with complicated logic such as multi-hop joins between fact and dimension sources and complex metric types, generating queries dynamically instead of requiring hand-written SQL for every cut of the data.

Documentation is hosted in the dbt docs, and a changelog tracks updates. MetricFlow suits analytics engineers and data teams who want a single source of truth for business metrics that can feed dashboards, notebooks, and other tools.

Key features

  • Metric definitions managed as code
  • Compiles metrics to engine-specific SQL
  • Dataflow-based query planning
  • Multi-hop joins across fact and dimension sources
  • Support for complex metric types
  • Consistent dimensions across queries

Pricing: Free and open source under the Apache-2.0 license.

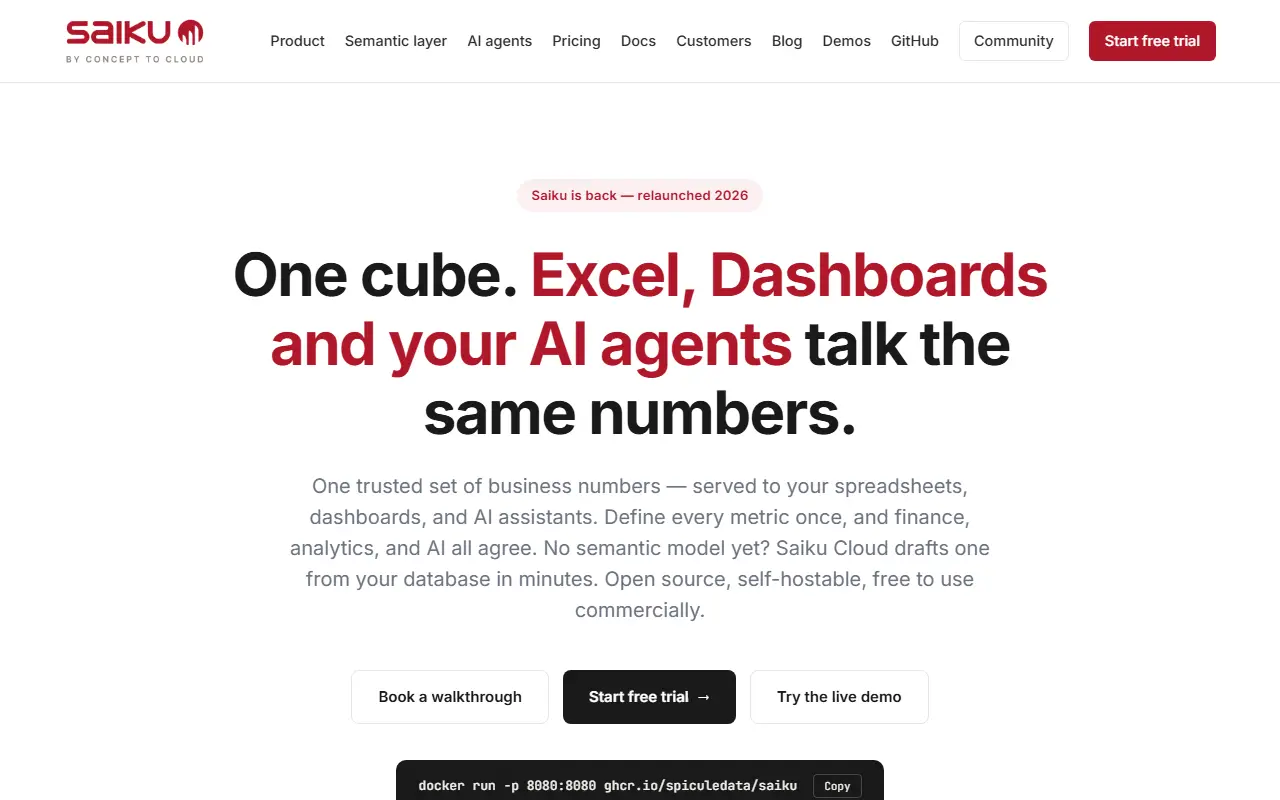
Saiku

Saiku is an open-source semantic layer and OLAP analytics tool built on Mondrian and Apache Calcite, serving Excel, dashboards and AI agents.

GitHub stars
1.3k
Last commit
today
Latest release
v4.8.0
Licence
Apache-2.0
Self-hosted
Yes
saiku.biSaiku homepage screenshot

Saiku began in 2010 as an open-source OLAP browser for Mondrian and was rebuilt in 2026 as a modern semantic layer for analytics. It defines business cubes once and then exposes them to different consumers: a drag-and-drop browser interface, Excel through MDX and XMLA, dashboards, and AI agents through MCP.

In the browser, users drag fields onto rows, columns and filters and the application writes MDX for them. The back end uses a fork of Mondrian 4.8 with an Apache Calcite-based SQL planner, which can reach modern engines such as lakehouse systems. A typed REST interface allows AI agents to query data without handling MDX. A demo mode ships with a self-contained H2 database and the FoodMart sample cube.

Saiku is written in Java and licensed under Apache-2.0. It runs from a Docker image, which runs as a non-root user and requires setting an admin password for real deployments, and a hosted demo instance resets nightly. It suits analytics and BI teams that need governed, reusable metric definitions across spreadsheets, dashboards and AI tools.

Key features

  • Drag-and-drop OLAP browser
  • MDX and XMLA access from Excel
  • Mondrian with Apache Calcite SQL planner
  • MCP and typed REST API for AI agents
  • Docker image with demo mode
  • Support for modern lakehouse engines

Pricing: Free and open source under the Apache-2.0 licence.

Looker alternatives: questions

What is the best open-source alternative to Looker?
Superset is the top-ranked open-source alternative to Looker on Enlisted: A web-based business intelligence platform from the Apache project with a no-code chart builder, SQL editor and dashboards that connects to most SQL databases. Other strong options are Metabase, Cube, Evidence and Lightdash.
Are these Looker alternatives free?
All 8 are open source, so the code is free to use under its licence, and all of them can be self-hosted on your own server or computer. 4 also offer a paid or managed cloud version if you'd rather not host it yourself.
How is this list of Looker alternatives ranked?
By a score built from GitHub stars, star growth over the last 30 days and how recently the code changed. 8 of these projects shipped code in the last 30 days. Data is refreshed daily, and nobody can pay to move up.

People also look for alternatives to…

View all