7,380 open-source and SaaS tools, with GitHub stats refreshed every day.

8 alternatives ranked by real activity

Open-source Zoho Analytics alternatives

A curated, ranked list of the 8 best open-source alternatives to Zoho Analytics.

The best open-source alternative to Zoho Analytics is Superset. If that doesn't suit you, other good options are Metabase, Redash, DataEase and Lightdash.

Zoho Analytics alternatives are mainly BI & dashboard tools. 7 of them shipped code in the last 30 days, 8 can be self-hosted, and 3 use a permissive licence.

Last updated October 2, 2026 · ranked by GitHub stars, growth and recent commits

Superset

A web-based business intelligence platform from the Apache project with a no-code chart builder, SQL editor and dashboards that connects to most SQL databases.

GitHub stars
75k
Last commit
today
Latest release
6.1.0
Licence
Apache-2.0
Self-hosted
Yes
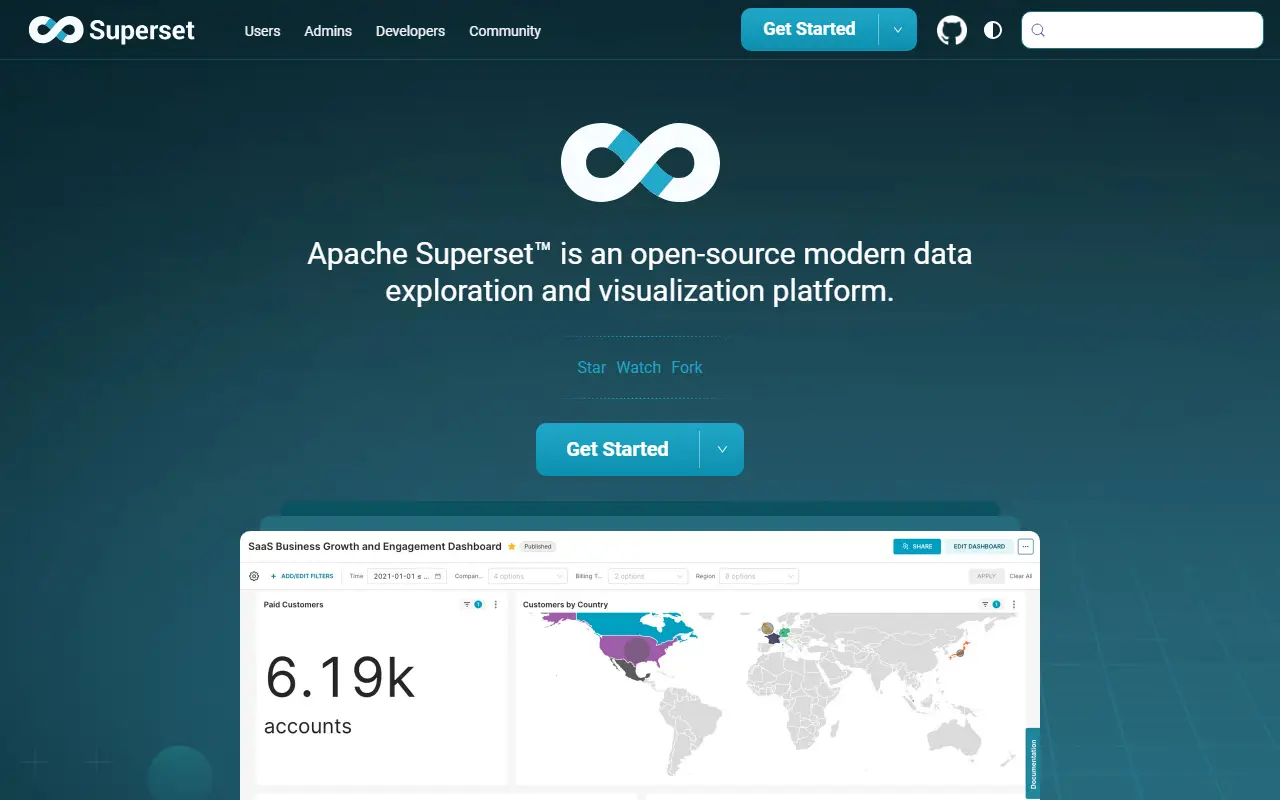
superset.apache.orgSuperset homepage screenshot

Apache Superset is a data exploration and visualization platform that runs as a web application. Analysts and business users can connect it to a database, build charts without code, assemble them into dashboards and share them, so it can augment or replace proprietary business intelligence tools for many teams.

The no-code chart builder sits next to a web-based SQL editor for advanced queries, and a lightweight semantic layer lets teams define reusable dimensions and metrics. Visualizations range from simple bar charts to geospatial views. Superset can query any SQL datastore or engine provided a matching Python database driver and SQLAlchemy dialect exist, including Presto, Trino and Athena. A configurable caching layer reduces database load, and security roles and authentication options are extensible.

The stack is Python with Flask on the back end and React on the front end, under the Apache-2.0 license. A REST API and extension framework allow programmatic control and customization. Documentation is split into guides for users, administrators and developers, and it is a typical choice for organizations that want a self-managed BI layer.

Key features

  • No-code chart builder
  • Web-based SQL editor
  • Shareable interactive dashboards
  • Lightweight semantic layer for metrics
  • Connects to any SQL database with a driver
  • Caching layer and security roles
  • REST API for programmatic customization

Pricing: Free and open source under the Apache-2.0 license.

Read more about SupersetWebsite GitHub

Metabase

An open-source BI and embedded analytics tool for exploring data, building dashboards and asking questions without SQL, self-hosted or through Metabase Cloud.

GitHub stars
50k
Last commit
today
Latest release
v0.63.19
Self-hosted
Yes
Hosted version
Available
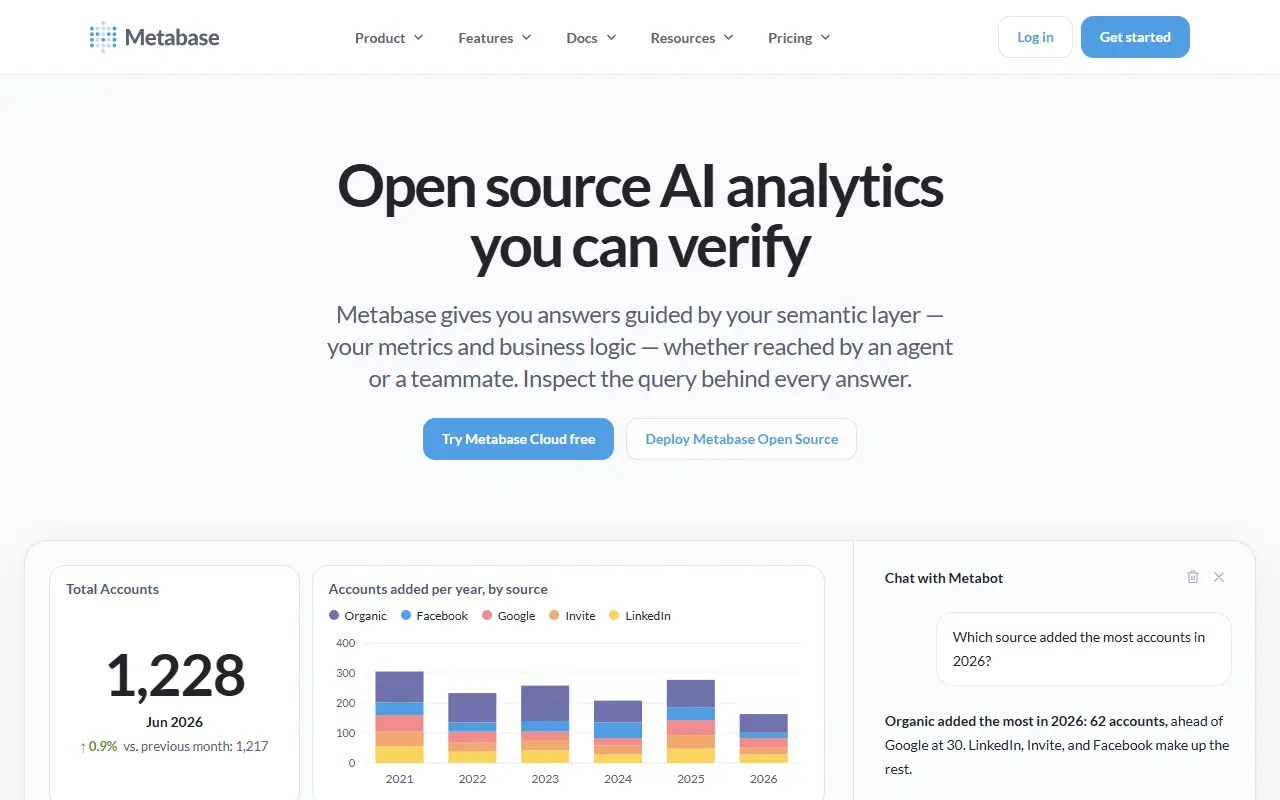
metabase.comMetabase homepage screenshot

Metabase is an open-source business intelligence and embedded analytics tool meant for everyone in a company, not only analysts. People can ask questions about their data without knowing SQL, while an SQL editor is available for more complex queries. Written in Clojure, it connects to databases such as PostgreSQL and MySQL.

Its features include interactive dashboards with filters, auto-refresh and custom click behavior, plus documents for long-form analysis that colleagues can comment on. An AI assistant called Metabot helps answer questions and write queries, and you can build your own AI agent against your data. Data Studio supports transforming raw data into analytics-ready tables and defining canonical metrics. Alerts and scheduled dashboard subscriptions go to email, Slack or a webhook, and a Library plus Git integration help version your work.

Metabase can also be embedded in your own product with components for charts, dashboards, a data browser and AI chat, and granular permissions work for internal teams and embedded customers. You can self-host it or use Metabase Cloud, which the project says includes support, backups, upgrades and a free trial. The repository license is listed as 'Other', so review its terms.

Key features

  • Question builder that needs no SQL
  • SQL editor for complex queries
  • Interactive dashboards with filters and auto-refresh
  • Alerts and scheduled subscriptions to email or Slack
  • Embedding of charts and dashboards in apps
  • Granular permissions for teams and customers
  • Metabot AI assistance for queries

Pricing: The open-source edition is free. Cloud Starter is $100 per month and Pro $575 per month with a 14-day trial; extra users cost $6 or $12 per month. Enterprise starts at $20,000 per year.

Read more about MetabaseWebsite GitHub

Redash

A browser-based tool for querying databases, visualizing results and sharing dashboards, with scheduled refreshes and alerts across many data sources.

GitHub stars
29k
Last commit
2 days ago
Latest release
v26.9.0
Licence
BSD-2-Clause
Self-hosted
Yes
redash.ioRedash homepage screenshot

Redash is an open-source business intelligence and data exploration tool that works entirely in the browser. SQL users connect it to a data source, write queries, turn results into visualizations and share them, so that colleagues without SQL skills can use the results too.

The query editor accepts both SQL and NoSQL queries and offers a schema browser plus auto-complete. Visualizations are built by drag and drop and can be combined into dashboards, and every chart or query has a shareable URL that supports collaboration and peer review. Charts and dashboards can refresh on a schedule, and alerts can notify you when results cross a threshold. Topics mention many sources, including Redshift, BigQuery, Athena, MySQL, PostgreSQL and Databricks.

Redash is written in Python and JavaScript and licensed under BSD-2-Clause. You deploy it on your own infrastructure, commonly with Docker, and it is aimed at analysts and engineers who want a lightweight, query-first dashboard tool rather than a heavy BI suite.

Key features

  • Query editor for SQL and NoSQL sources
  • Schema browser with auto-complete
  • Drag-and-drop chart building
  • Shareable dashboards and queries
  • Scheduled dashboard refreshes
  • Alerts on query results

Pricing: Free and open source under the BSD-2-Clause license.

Read more about RedashWebsite GitHub

DataEase

DataEase is an open-source business intelligence tool for building charts and dashboards by drag and drop, positioned as a Tableau alternative.

GitHub stars
25k
Last commit
2 days ago
Latest release
v3.1.0
Self-hosted
Yes

DataEase is an open-source BI tool that helps users analyze data and spot business trends. It connects to a wide range of data sources, lets you build charts by dragging and dropping, and supports sharing results with others. The project describes itself as an open-source alternative to Tableau and is developed by FIT2CLOUD in Java, with a Chinese-language README.

Supported data sources include OLTP databases such as MySQL, Oracle, SQL Server, PostgreSQL, MariaDB, Db2, TiDB and MongoDB, OLAP engines such as ClickHouse, Apache Doris, Apache Impala and StarRocks, Amazon Redshift, Excel and CSV files, and API sources. The stack uses Vue.js, Spring Boot, AntV for charts, Apache Calcite and SeaTunnel, and Docker. Installation uses an offline package on a Linux server with at least 2 cores and 4 GB of memory, or the 1Panel app store. V3 uses the FIT2CLOUD Open Source License, essentially GPLv3 with extra restrictions, and commercial licensing is available.

Key features

  • Drag-and-drop chart and dashboard building
  • Connectors for MySQL, PostgreSQL, ClickHouse and more
  • Support for Excel, CSV and API data sources
  • Several secure data sharing methods
  • Embedding support for other applications
  • Docker-based deployment on Linux servers

Pricing: Source available under the FIT2CLOUD Open Source License, a GPLv3 variant with extra restrictions; commercial licensing is available on request.

Read more about DataEaseWebsite GitHub

Lightdash

Lightdash is an open-source BI platform that defines metrics as code, with dashboards, AI agents and data apps built on a shared context layer.

GitHub stars
6.2k
Last commit
today
Latest release
2.423.2
Self-hosted
Yes
Hosted version
Available
lightdash.comLightdash homepage screenshot

Lightdash is an open-source business intelligence platform that it describes as agentic BI, meant for data teams that want analytics to be shipped like software. Metrics, joins, permissions, business logic and caching are defined once in a context layer, and that layer feeds MCP, SDKs, embedded analytics, data apps, AI agents and dashboards.

Analytics can be built as code: metrics, charts and dashboards live as files that you can edit with coding agents, preview from the Lightdash CLI, validate in CI and review in pull requests. Business users can pose questions in plain English, browse dashboards or build custom data apps, all while governance stays in place. Agents answer from the context layer rather than guessing from raw tables, respect permissions and return queries that can be inspected. The repository topics mention dbt.

Lightdash is written in TypeScript. The vendor recommends starting with Lightdash Cloud, which needs no infrastructure to run, and also offers a live demo, documentation and a sales call. The repository lists its licence as other, so check the terms before self-hosting.

Key features

  • Context layer for metrics and permissions
  • BI as code with CLI and CI validation
  • AI agents that answer from governed metrics
  • Dashboards and custom data apps
  • Embedded analytics, SDKs and MCP
  • dbt-based workflow

Pricing: Self-hosted Open Source edition with community support. Cloud Pro is $3000 per month with unlimited users and a 21-day trial; Enterprise is quoted.

Read more about LightdashWebsite GitHub

Chartbrew

Chartbrew is an open-source reporting platform that turns data from APIs, SQL and NoSQL databases into live dashboards and embeddable charts.

GitHub stars
4.1k
Last commit
4 days ago
Latest release
v5.3.2
Self-hosted
Yes
Hosted version
Available
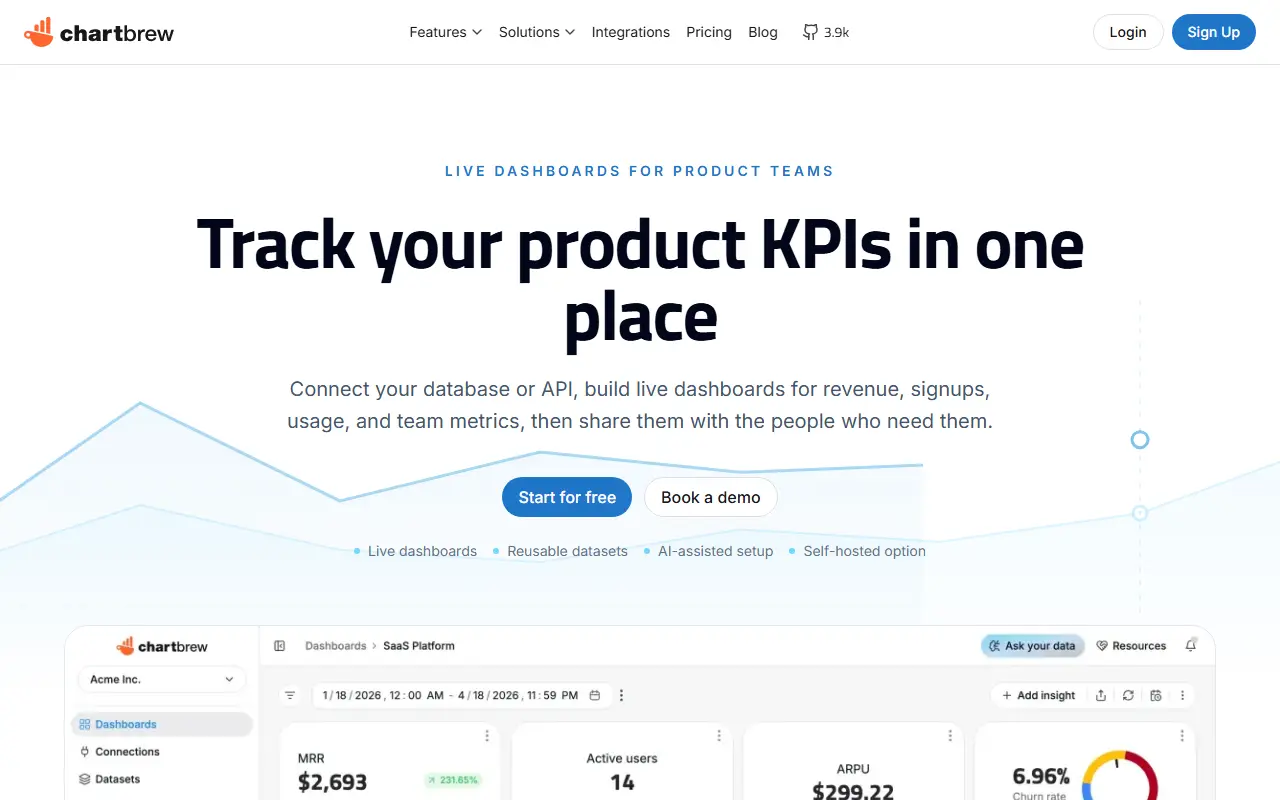
chartbrew.comChartbrew homepage screenshot

Chartbrew is an open-source web application that connects directly to databases and APIs and uses the data to build charts and dashboards. Its tools include a chart builder, editable dashboards, embeddable charts, a query and request editor and team features for sharing reports.

The platform also includes an AI assistant and scheduling, and its topics reference MySQL, PostgreSQL, MongoDB, Firestore and Firebase as data sources, with the latest list of supported sources on the project website. To self-host, the README lists Node.js 22 or newer, MySQL 5 or PostgreSQL 12.5 or newer, and Redis 6 or newer as prerequisites. The front end uses React and the back end Node.js.

A hosted Chartbrew service is available, and the repository license is listed as 'Other' on GitHub, so check the terms for your use. Chartbrew suits agencies, startups and teams who want shareable client dashboards without building a BI stack.

Key features

  • Chart builder and editable dashboards
  • Connects to APIs, SQL and NoSQL data
  • Charts that can be embedded
  • Query and request editor
  • AI assistant and scheduling
  • Team collaboration features

Pricing: No free cloud plan, but there is a 14-day trial and a free self-hosted option. Starter is $29, Growth $99 and Professional $299 per month, cheaper billed yearly; Enterprise is custom.

Read more about ChartbrewWebsite GitHub

Frappe Insights

Frappe Insights is an open-source business intelligence tool with a no-SQL query builder, charts, dashboards and support for MySQL, PostgreSQL, DuckDB and BigQuery.

GitHub stars
1k
Last commit
yesterday
Latest release
v3.14.2
Licence
AGPL-3.0
Self-hosted
Yes
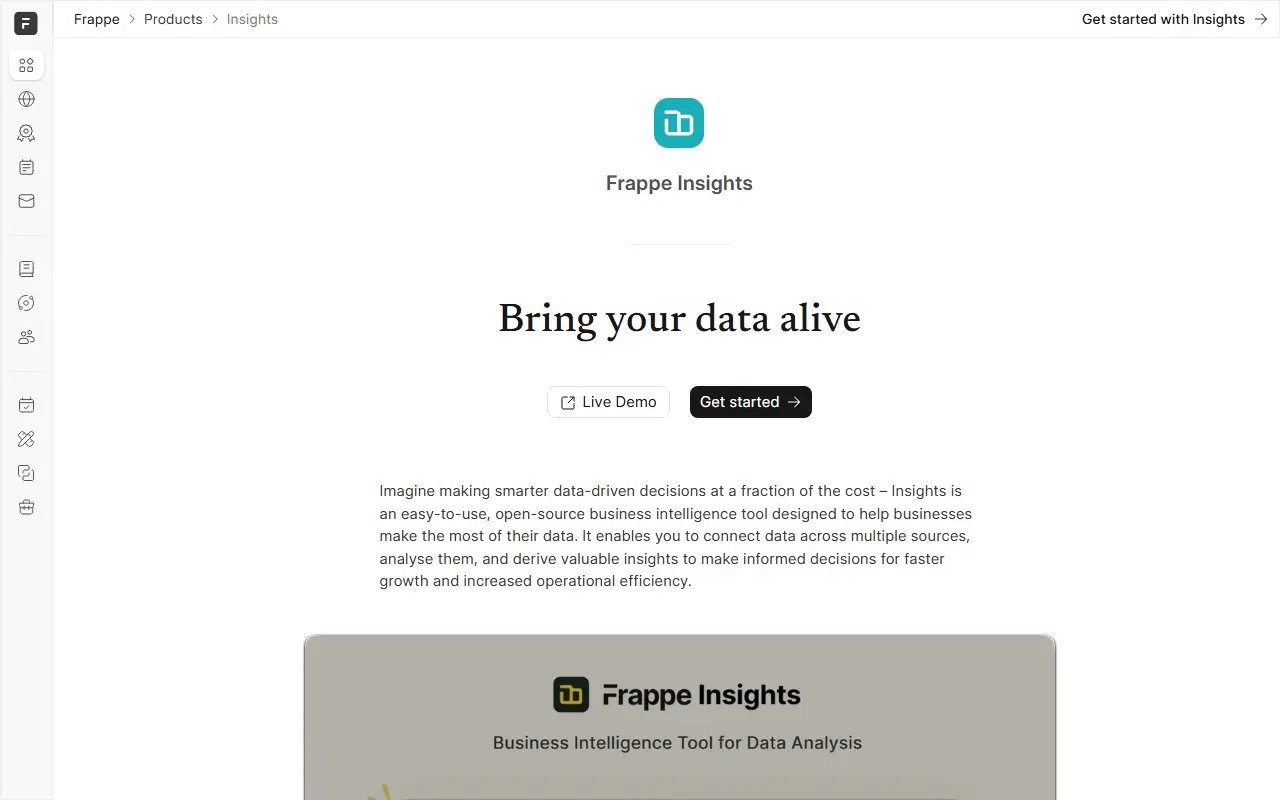
frappe.ioFrappe Insights homepage screenshot

Frappe Insights is an open-source business intelligence tool that aims to make data analysis and reporting accessible to both technical and non-technical users. It grew out of the experience of working with Frappe Framework applications, where building structured data was easy but extracting reports usually required SQL knowledge.

You can connect multiple sources, including databases, files and spreadsheets, and use a step-by-step query builder to select tables, add joins, apply filters and calculations without writing SQL. Results can be visualized with various charts, with the tool suggesting a fitting chart, and dashboards are assembled by drag and drop with dashboard filters. Supported databases include MySQL, PostgreSQL, DuckDB and BigQuery. A SQL editor is also available.

Insights is built on the Frappe Framework, Frappe UI with Vue, and the Ibis library for composing SQL with dataframe APIs. It is written in Python, licensed under AGPL-3.0, and can be self-hosted, with a live demo and documentation. It suits ERPNext and Frappe users as well as teams wanting a lightweight BI tool.

Key features

  • Query builder that needs no SQL
  • Connections to multiple data sources
  • Chart suggestions and visualizations
  • Drag-and-drop dashboards with filters
  • MySQL, PostgreSQL, DuckDB, and BigQuery support
  • SQL editor for advanced users

Pricing: Free and open source under the AGPL-3.0 licence.

DataLens

DataLens is a business intelligence and data visualization system, developed at Yandex, that you can run on your own servers with Docker.

GitHub stars
1.7k
Last commit
1 mo ago
Latest release
v2.9.0
Licence
Apache-2.0
Self-hosted
Yes
Hosted version
Available
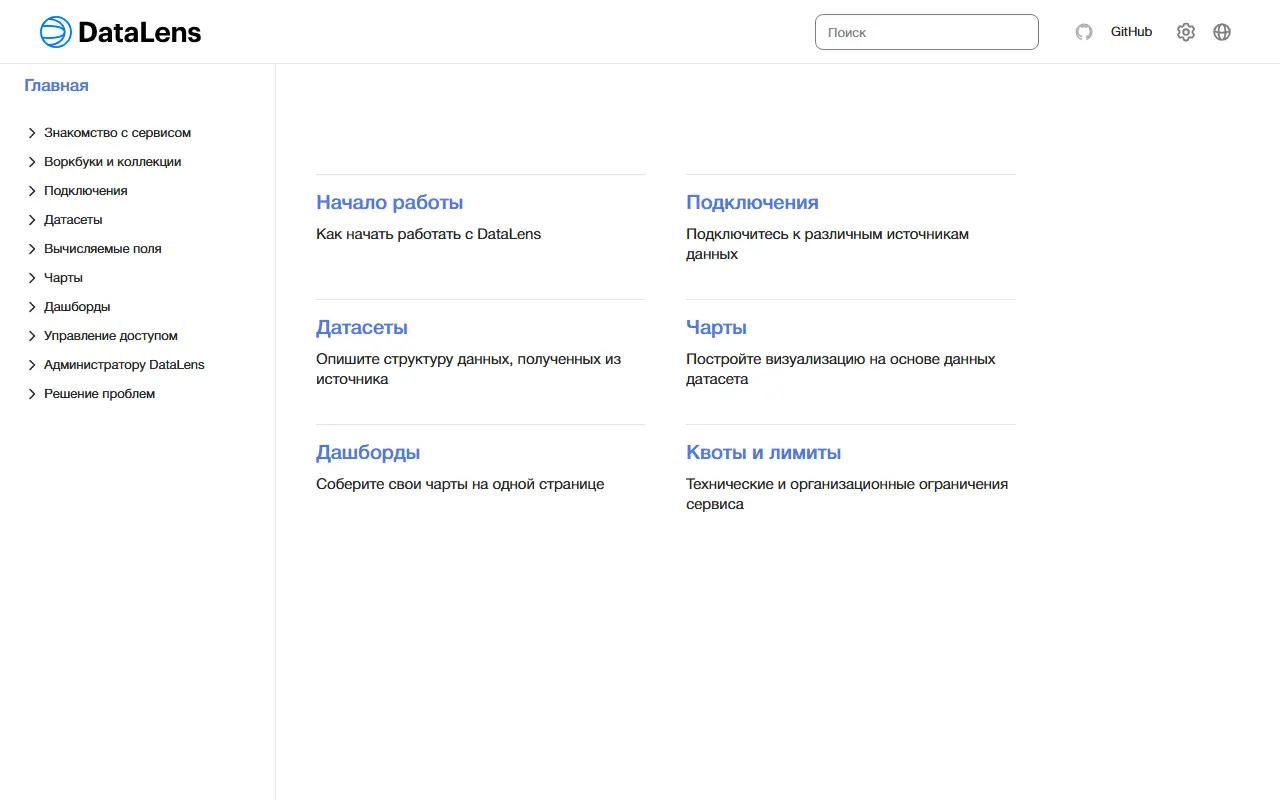
datalens.techDataLens homepage screenshot

DataLens is a modern business intelligence and data visualization system. It was developed and used extensively as a primary BI tool inside Yandex and is also offered as part of the Yandex Cloud platform, while the open-source version can be run independently.

Topics describe it as an analytics, dashboard, reporting and SQL visualization tool. The quick start needs Docker and the Docker Compose plugin; cloning the repository and running a start command launches all containers, and the UI is then available on port 8080, which can be changed with an environment variable. For production use the maintainers recommend generating a compose file with random secrets, which stores a generated admin password in the environment file.

Charts can use D3.js, or the proprietary Highcharts library if you enable it, in which case you must comply with Highcharts' own license. DataLens is licensed under Apache-2.0, has a roadmap, release notes and a Telegram community, and suits teams that want self-hosted dashboards.

Key features

  • Dashboards and data visualization
  • SQL-based datasets and charts
  • Docker Compose deployment
  • Generated secrets for production setups
  • D3.js charts with optional Highcharts
  • Also available in Yandex Cloud

Pricing: Free and open source under the Apache-2.0 license; a managed version is part of Yandex Cloud.

Read more about DataLensWebsite GitHub

Zoho Analytics alternatives: questions

What is the best open-source alternative to Zoho Analytics?
Superset is the top-ranked open-source alternative to Zoho Analytics on Enlisted: A web-based business intelligence platform from the Apache project with a no-code chart builder, SQL editor and dashboards that connects to most SQL databases. Other strong options are Metabase, Redash, DataEase and Lightdash.
Are these Zoho Analytics alternatives free?
All 8 are open source, so the code is free to use under its licence, and all of them can be self-hosted on your own server or computer. 4 also offer a paid or managed cloud version if you'd rather not host it yourself.
How is this list of Zoho Analytics alternatives ranked?
By a score built from GitHub stars, star growth over the last 30 days and how recently the code changed. 7 of these projects shipped code in the last 30 days. Data is refreshed daily, and nobody can pay to move up.

People also look for alternatives to…

View all